(1) | The Board of Directors appointed members to each of our Board committees in October 2016, resulting in prorata payments to certain directors, based on the number of quarters such director served on the committee to which they were appointed. | | | | | | | | | | | |
(2) | The amounts shown in this column reflect the grant date fair value of DSU awards determined in accordance with ASC Topic 718, excluding the effects of forfeitures. We determine the grant date fair value of each DSU award using the closing price of our common stock on the date of grant. Each director forfeits the unvested portion, if any, of the director’s DSU award if the director’s service to our company is terminated for any reason, except as may otherwise be determined by the plan committee appointed by our Board of Directors as the administrator of our 2010 Plan. There were no forfeitures of DSUs by our directors in fiscal 2017. As of June 24, 2017, each of the non-employee directors had 1,152 shares underlying DSU awards outstanding. |
(3) | The amounts shown in this column reflect the grant date fair value of stock option awards determined in accordance with ASC Topic 718, excluding the effects of forfeitures. The assumptions used in determining grant date fair value of our awards are set forth in the notes to our consolidated financial statements, which are included in our Annual Report on Form 10-K filed with the SEC for the fiscal year ended June 24, 2017. Each director forfeits the unvested portion, if any, of the director’s stock options if the director’s service to our company is terminated for any reason, except as may otherwise be determined by the plan committee appointed by our Board of Directors, as the administrator of our 2010 Plan. There were no forfeitures of stock options by our directors in fiscal 2017. As of June 24, 2017, each of our non-employee directors had the following number of stock option awards outstanding: Mr. Lee (392,227); Mr. Buchanan (10,215); Mr. Chan (45,852); Mr. Geeslin (18,102); Mr. Knittel (22,002); Mr. Sanquini (8,727); and Mr. Whims (24,102). |
(4) | Represents the value of our common stock paid to Mr. Sanquini as his annual retainer for Board and committee services as Mr. Sanquini elected to receive his annual retainer in shares of our common stock. |
(1) The Board of Directors appointed members to each of our Board committees in October 2018, resulting in pro rata payments to certain directors, based on the number of quarters such director served on the committee to which they were appointed. (2) The amounts shown in this column reflect the grant date fair value of DSU awards determined in accordance with ASC Topic 718, excluding the effects of forfeitures. We determine the grant date fair value of each DSU award using the closing price of our common stock on the date of grant. Each director forfeits the unvested portion, if any, of the director’s DSU award if the director’s service to our company is terminated for any reason, except as may otherwise be determined by the plan committee appointed by our Board of Directors as the administrator of our 2010 Plan. There were no forfeitures of DSUs by our directors in fiscal 2018. As of June 29, 2019, each of the non-employee directors had 1,304 shares underlying DSU awards outstanding, except for Ms. Allgood who had 861 shares underlying an outstanding DSU award. (3) Mr. Chan received a pro rata payment for his service as the Executive Chairman of our Board from March 2019 through the end of our fiscal year. (4) Ms. Allgood received a pro rata amount of director fees and DSUs in connection with her appointment to our Board in May 2019. (5) Represents the value of our common stock paid to Mr. Sanquini as his annual retainer for Board and committee services as Mr. Sanquini elected to receive his annual retainer in shares of our common stock. REPORT OF THE AUDIT COMMITTEE Our Board of Directors has appointed an Audit Committee consisting of fourthree directors. The current members of the Audit Committee are Jeffrey D. Buchanan, Nelson C. Chan, Keith B. Geeslin and Russell J. Knittel.Knittel, and Francis F. Lee. Each of the Audit Committee members is “independent” of our company and management, as that term is defined under applicable NASDAQ listing standards and SEC rules. The primary responsibility of the committee is to assist our Board of Directors in fulfilling its responsibility to oversee management’s conduct of our company’s financial reporting process, including overseeing the financial reports and other financial information provided by our company to governmental or regulatory bodies (such as the SEC), the public, and other users thereof; our company’s systems of internal accounting and financial controls; and the annual independent audit of our company’s financial statements. Management has the primary responsibility for the financial statements and the reporting process, including the systems of internal controls. The independent auditor is responsible for auditing the financial statements and expressing an opinion on the conformity of those audited financial statements with GAAP. In fulfilling its oversight responsibilities, the committee reviewed and discussed the audited financial statements with management and the independent auditor. The committee discussed with the independent auditor the matters required to be discussed by Auditing Standards No. 1301, “Communications with Audit Committees.” This included a discussionthe applicable requirements of the auditor’s judgments as to the quality – not just the acceptability – of our company’s accounting principles and such other matters as are required to be discussed with the committee under generally accepted auditing standards.Public Company Accounting Oversight Board. In addition, the committee received from the independent auditor written disclosures and the letter required by applicable requirements of the Public Company Accounting Oversight Board regarding the independent auditor’s communications with the committee concerning independence. The committee also discussed with the independent auditor the auditor’s independence from management and our company, including the matters covered by the written disclosures and letter provided by the independent auditor, and considered the compatibility ofnon-audit services with auditor independence. The committee discussed with the independent auditor the overall scope and plans for its audits. The committee met with the independent auditor, with and without management present, to discuss the results of its audit, its consideration of our company’s internal controls, and the overall quality of the financial reporting. The committee held sixfive meetings with management of our company, all of which were attended by our independent auditor, with respect to our company’s financial statements and audit or quarterly review procedures. Based on the reviews and discussions referred to above, the committee recommended to our Board of Directors, and our Board of Directors approved that the audited financial statements be included in our company’s Annual Report on Form10-K for the fiscal year ended June 24, 201729, 2019 for filing with the SEC. The committee also has appointed our company’s independent auditor. This report has been furnished by the Audit Committee of the Board of Directors. | | | | | Respectfully submitted, | | | | | | | Keith B. Geeslin, ChairmanRespectfully submitted,
| | | | | | | | Jeffrey D. Buchanan, Chairman Nelson C. Chan
| | | | | Russell J. Knittel | | | | | Francis F. Lee |
SECTION 16(a) BENEFICIAL OWNERSHIP REPORTING COMPLIANCE
Section 16(a) of the Exchange Act requires our directors, executive officers, and persons that own more than 10% of a registered class of our company’s equity securities to file reports of ownership and changes in ownership with the SEC. Directors, officers, and greater than 10% stockholders are required by SEC regulations to furnish our company with copies of all Section 16(a) forms they file. Our administrative staff typically assists our executive officers and directors in preparing initial ownership reports and reporting ownership changes, and typically causes those reports to be filed on their behalf.
Based solely upon our review of the copies of such forms received by us during the fiscal year ended June 24, 2017, and written representations from our directors and executive officers that no other reports were required, we believe that each person who, at any time during such fiscal year, was a director, officer, or beneficial owner of more than 10% of our common stock complied with all Section 16(a) filing requirements during such fiscal year.
SECURITY OWNERSHIP OF PRINCIPAL STOCKHOLDERS, DIRECTORS, AND OFFICERS The following table sets forth certain information regarding the beneficial ownership of our common stock as of August 18, 201719, 2019 by (1) each director; (2) the Named Executive Officers listed in the Fiscal 20172019 Summary Compensation Table; (3) all directors and current executive officers as a group; and (4) each person or entity known by us to beneficially own or to exercise voting or dispositive control over more than 5% of our common stock. | | | | | | | | | | | | Shares Beneficially Owned | | Name of Beneficial Owner | | Number(1) | | | Percent(2) | | Directors and Named Executive Officers: | | | | | | | | | Richard A. Bergman(3) | | | 368,048 | | | | 1.1 | % | Wajid Ali(4) | | | 30,592 | | | | * | | Kevin D. Barber(5) | | | 35,743 | | | | * | | Jeffrey D. Buchanan(6) | | | 14,688 | | | | * | | Nelson C. Chan(7) | | | 61,887 | | | | * | | Keith B. Geeslin(8) | | | 29,637 | | | | * | | Russell J. Knittel(9) | | | 38,071 | | | | * | | Francis F. Lee(10) | | | 472,855 | | | | 1.4 | % | Richard L. Sanquini(11) | | | 18,839 | | | | * | | Huibert Verhoeven(12) | | | 37,645 | | | | * | | James L. Whims(13) | | | 45,325 | | | | * | | Alex Wong(14) | | | 77,262 | | | | * | | All directors and current executive officers as a group (15 persons)(15) | | | 1,268,569 | | | | 3.7 | % | | | | 5% Stockholders | | | | | | | | | The Vanguard Group(16) | | | 3,771,139 | | | | 11.2 | % | Ameriprise Financial, Inc.(17) | | | 3,679,729 | | | | 10.9 | % | Blackrock, Inc.(18) | | | 3,650,195 | | | | 10.8 | % |
| | | | | | | | | | Shares Beneficially Owned | | | | Name of Beneficial Owner | | Number(1) | | | Percent(2) | Directors and Named Executive Officers: | | | | | | | Michael E. Hurlston | | | - | | | * | Richard A. Bergman(3) | | | 441,112 | | | 1.3% | Kermit Nolan(4) | | | 60,562 | | | * | Wajid Ali | | | 12,256 | | | * | Kiva A. Allgood | | | 861 | | | * | Jeffrey D. Buchanan(5) | | | 24,798 | | | * | Nelson C. Chan(6) | | | 62,997 | | | * | Keith B. Geeslin(7) | | | 39,747 | | | * | Russell J. Knittel(8) | | | 33,181 | | | * | Francis F. Lee(9) | | | 64,465 | | | * | Shawn Liu(10) | | | 27,209 | | | * | Richard Lu | | | - | | | * | John McFarland(11) | | | 46,099 | | | * | Richard L. Sanquini(12) | | | 32,582 | | | * | Huibert Verhoeven | | | 22,330 | | | * | James L. Whims(13) | | | 55,435 | | | * | Alex Wong(14) | | | 120,433 | | | * | All directors and current executive officers as a group (15 persons)(15) | | | 576,181 | | | 1.7% | | | | 5% Stockholders | | | | | | | Ameriprise Financial, Inc.(16) | | | 4,556,275 | | | 13.8% | The Vanguard Group(17) | | | 4,193,989 | | | 12.7% | Blackrock, Inc.(18) | | | 4,115,885 | | | 12.5% | Franklin Mutual Advisors, LLC(19) | | | 2,116,501 | | | 6.4% | Dimensional Fund Advisors LP(20) | | | 1,741,214 | | | 5.3% | | | | | | | |
| (1) | Except as otherwise indicated, each person named in the table has sole voting and investment power with respect to all common stock beneficially owned, subject to applicable community property laws. Except as otherwise indicated, each person may be reached at 1251 McKay Drive, San Jose, California 95131-1709. The numbers and percentages shown include the shares of common stock actually owned as of August 18, 2017,19, 2019, and the shares of common stock that the identified person or group had the right to acquire within 60 days of such date to the extent known by us. |
| (2) | The percentages shown are calculated based on 33,732,82732,910,891 shares of common stock outstanding on August 18, 2017.19, 2019. In calculating the percentage of ownership, all shares of common stock that the identified person or group had the right to acquire within 60 days of August 18, 2017,19, 2019, upon the exercise of stock options or the vesting of DSU awards, are deemed to be outstanding for the purpose of computing the percentage of the shares of common stock owned by that person or group, but are not deemed to be outstanding for the purpose of computing the percentage of the shares of common stock owned by any other person. |
| (3) | Includes 314,818353,898 shares issuable upon exercise of vested stock options. Mr. Bergman has shared voting power and no investment power with respect to a portion of the shares. |
| (4) | Includes 29,99921,599 shares issuable upon exercise of vested stock options. |
| (5) | Includes 35,30710,215 shares issuable upon exercise of vested stock options. |
| (6) | Includes 9,97330,852 shares issuable upon exercise of vested stock options. |
| (7) | Includes 45,61018,102 shares issuable upon exercise of vested stock options. |
| (8) | Includes 17,860 shares issuable upon exercise of vested stock options. |
(9) | Includes 16,31126,179 shares held by Russell J. Knittel and Veronica Knittel asCo-Trustees of The Knittel Revocable Living Trust and 21,7607,002 shares issuable upon exercise of vested stock options. |
(10) | (9) | Includes 36,48926,274 shares held by the EF Lee Family 2012 Irrevocable Trust and 391,98512,102 shares issuable upon exercise of vested stock options. |
| (10) | Includes 11,243 shares issuable upon exercise of vested stock options. |
| (11) | Includes 10,34639,499 shares issuable upon exercise of vested stock options. |
| (12) | Includes 717 shares held by Richard L. Sanquini as trustee of the Sanquini 2002 Living Trust dated January 22, 2002 and 8,4858,727 shares issuable upon exercise of vested stock options. |
(12) | (13) | Includes 30,11118,102 shares issuable upon exercise of vested stock options. |
(13) | (14) | Includes 23,86080,368 shares issuable upon exercise of vested stock options. |
(14) | (15) | Includes 54,621257,811 shares issuable upon exercise of vested stock options. |
(15) | Includes 1,013,606 shares issuable upon exercise of vested stock options. |
| (16) | The information is as reported on Amendment No. 67 to Schedule 13G/A as filed on February 10, 2017. The Vanguard Group, Inc. has sole power to direct the disposition of 3,699,102 shares, shared power to direct the disposition of 72,037 shares, sole power to vote 69,444 shares, and shared power to vote 4,390 shares. Vanguard Fiduciary Trust Company, a wholly owned subsidiary of The Vanguard Group, Inc., is the beneficial owner of 67,647 shares as a result of its serving as investment manager of collective trust accounts. Vanguard Investments Australia, Ltd., a wholly owned subsidiary of The Vanguard Group, Inc., is the beneficial owner of 6,187 shares as a result of its serving as investment manager of Australian investment offerings. The principal address of The Vanguard Group, Inc. is 100 Vanguard Blvd., Malvern, PA 19355. |
(17) | The information is as reported on Amendment No. 5 to Schedule 13G/A as filed on February 10, 2017.14, 2019. Ameriprise Financial, Inc., or AFI, has shared power to direct the disposition of 3,679,7294,556,275 shares and shared power to vote 3,636,8754,439,480 shares. AFI is the parent holding company of Columbia Management Investment Advisors, LLC, or CMIA, which has shared power to direct the disposition of 3,679,7294,542,021 shares and shared power to vote 3,636,8754,439,480 shares. CMIA is the investment advisor to Columbia Seligman Communications & Information Fund, or the Fund, an investment company, which has the shared power to direct the disposition of 2,413,7492,921,045 shares and sole power to vote 2,413,7492,921,045 shares. Both AFI and CMIA disclaim beneficial ownership of any shares reported on this Schedule 13G/A. The principal address of AFI is 145 Ameriprise Financial Center, Minneapolis, MN 55474 and the principal address of CMIA and the Fund is 225 Franklin Street, Boston, MA 02110. |
(18) | (17) | The information is as reported on Amendment No. 8 to Schedule 13G/A as filed on January 9, 2017.February 13, 2019. The Vanguard Group, Inc., has sole power to direct the disposition of 4,154,889 shares, shared power to direct the disposition of 39,100 shares, sole power to vote 38,107 shares, and shared power to vote 4,390 shares. Vanguard Fiduciary Trust Company, a wholly owned subsidiary of The Vanguard Group, Inc., is the beneficial owner of 34,710 shares as a result of its serving as investment manager of collective trust accounts. Vanguard Investments Australia, Ltd., a wholly owned subsidiary of The Vanguard Group, Inc., is the beneficial owner of 7,787 shares as a result of its serving as investment manager of Australian investment offerings. The principal address of The Vanguard Group, Inc. is 100 Vanguard Blvd., Malvern, PA 19355. |
| (18) | The information is as reported on Amendment No. 10 to Schedule 13G/A as filed on February 11, 2019. BlackRock, Inc. has sole power to direct the disposition of 3,650,1954,115,885 shares and sole power to vote 3,555,4563,998,894 shares. The principal address of BlackRock, Inc. is 55 East 52nd Street, New York, NY 10055. |
| (19) | The information is as reported on Schedule 13G as filed on January 30, 2019. Franklin Mutual Advisors, LLC (“FMA”), an indirect wholly-owned subsidiary of Franklin Resources, Inc. (“FRI”), has sole power to direct the disposition of 2,116,501 shares and sole power to vote 1,949,079 shares independently of FRI and in connection with investment management contract(s) which delegate to FMA such power. Charles B. Johnson and Rupert H. Johnson, Jr. each own 10% or more of the outstanding common stock of FRI and are thus, the principal shareholders of FRI (the “Principal Shareholders”). Since FMA exercises voting and investment powers independently of FRI, beneficial ownership of the securities reported by FMA is not attributed to the Principal Shareholders. FMA also disclaims beneficial ownership of any shares reported on this Schedule 13G/A. The principal address of FMA is 101 John F. Kennedy Parkway, Short Hills, NJ 07078. |
| (20) | The information is as reported on Schedule 13G as filed on February 8, 2019. Dimensional Fund Advisors LP, in its role as investment advisor,sub-advisor and/or manager to certain investment companies, commingled funds, group trusts and separate accounts (collectively, the “Funds”), has sole power to direct the disposition of 1,741,214 shares and sole power to vote 1,690,530 shares. Dimensional Fund Advisors, LP disclaims beneficial ownership of any shares reported on this Schedule 13G/A as all securities reported on this Schedule are owned by the Funds. The principal address of Dimensional Fund Advisors, LP is Building One, 6300 Bee Cave Road, Austin, TX 78746. |
CERTAIN RELATIONSHIPS AND RELATED TRANSACTIONS Unless delegated to the Compensation Committee by our Board of Directors, the Audit Committee charter requires that the Audit Committee review and approve all related party transactions and review and make recommendations to the full Board of Directors, or approve, any contracts or other transactions with current or former executive officers of our company, including consulting arrangements, employment agreements, change of control agreements, termination arrangements, and loans to employees made or guaranteed by our company. Our Audit Committee and our Board of Directors will only approve those related party transactions that, in light of known circumstances, are in, or are not inconsistent with, our best interests. There were no transactions or series of similar transactions since the beginning of fiscal 20172019 to which we were or are a party that involved an amount exceeding $120,000, and in which any of our directors, nominees for director, executive officers, holders of more than 5% of any class of our voting securities, or any member of the immediate family of any of the foregoing persons, had or will have a direct or indirect material interest. Our company has entered into indemnification agreements with each of our directors and executive officers. These agreements require us to indemnify such individuals to the fullest extent permitted by Delaware law for certain liabilities to which they may become subject as a result of their affiliation with our company. PROPOSAL TWO: ADVISORY VOTE ON NAMED EXECUTIVE OFFICER COMPENSATION(“SAY-ON-PAY”) Summary In accordance with Section 14A(a)(1) of the Dodd-FrankExchange Act, we are asking our stockholders to provide advisory approval of the compensation of our Named Executive Officers, as such compensation is described in the Compensation Discussion and Analysis, the tabular disclosure regarding such compensation, and the accompanying narrative disclosure set forth in this Proxy Statement, beginning on page 13.14. Our executive compensation program is designed to enable us to attract, motivate, and retain highly qualified executive officers. The program links cash incentive compensation to the achievement ofpre-established corporate financial performance and personalindividual performance objectives, and provides long-term stock-based incentive compensation that focuses our executive officer’s efforts on building stockholder value by aligning their interests with those of our stockholders. We urge our stockholders to review the Compensation Discussion and Analysis and Executive Compensation sections of this Proxy Statement and the related tabular and narrative disclosure for more information. Proposed Resolution and Vote Required Advisory approval of this proposal will require the affirmative vote of a majority of the votes cast on the proposal, assuming that a quorum is present at the Annual Meeting of Stockholders. The following resolution is submitted for a stockholder vote at the Annual Meeting of Stockholders: RESOLVED,that the stockholders of the company approve, on an advisory basis, the compensation of the company’s Named Executive Officers, as disclosed in the Compensation Discussion and Analysis and the related tabular and narrative disclosure as set forth in this Proxy Statement. This proposal is advisory, and therefore not binding on our company, our Compensation Committee, or our Board of Directors. Althoughnon-binding, the vote will provide information to our Compensation Committee and our Board of Directors regarding investor sentiment about our executive compensation philosophy, policies, and practices, which our Compensation Committee and our Board of Directors will be able to consider when making future executive compensation decisions. We currently conduct annual advisory votes on executiveNamed Executive Officer compensation, and we expect to conduct the next advisory vote at our 20182020 Annual Meeting of Stockholders, subject to a determination by our Board of Directors to do so after taking into consideration our stockholders’ preference on the say-on-frequency proposal at the Annual Meeting of Stockholders, described in this Proxy Statement as Proposal Three.Stockholders. Board Recommendation Our Board of Directors believes that the information provided above and within the Compensation Discussion and Analysis and Executive Compensation sections of this Proxy Statement demonstrates that our executive compensation program is designed appropriately and is working to ensure that our executive officers’ interests are aligned with our stockholders’ interests to support long-term value creation. OUR BOARD OF DIRECTORS UNANIMOUSLY RECOMMENDS THAT STOCKHOLDERS VOTE “FOR” ADOPTION OF THE RESOLUTION APPROVING THE COMPENSATION OF OUR NAMED EXECUTIVE OFFICERS, AS DESCRIBED IN THE COMPENSATION DISCUSSION AND ANALYSIS AND THE RELATED TABULAR AND NARRATIVE DISCLOSURE SET FORTH IN THIS PROXY STATEMENT. PROPOSAL THREE: ADVISORY VOTE ON DETERMINING THE FREQUENCY OF SAY-ON-PAY
Background
The Dodd-Frank Act enables our stockholders to indicate, at least once every six years, how frequently they believe we should seek an advisory vote on the compensation of our named executive officers. Stockholders have the option of recommending a frequency vote every year, every two years, or every three years or abstaining from making a recommendation. For our first say-on-frequency vote at our 2011 Annual Meeting of Stockholders, our Board of Directors recommended an annual say-on-pay vote and our stockholders concurred, casting a majority of their votes in favor of a “one year” frequency. We have held a say-on-pay vote for each of the past five years accordingly.
Summary
Our Board of Directors has considered the advantages and disadvantages of the frequency of the say-on-pay vote. Based on its analysis, our Board of Directors believes that continuing to hold an annual advisory vote on executive compensation would be the most meaningful for our Board of Directors and our Compensation Committee, and best serve the interests of our company and its stockholders. Our Board of Directors believes an annual advisory vote will provide the most timely feedback on executive compensation arrangements, plans, programs, and policies as executive compensation disclosures are made annually.
Stockholders should recognize, however, it may not be appropriate or feasible to change compensation programs already in place for the year in which the vote occurs since the advisory vote on executive compensation will take place after the beginning of the compensation year. Stockholders also should recognize that their recommendation may be modified in the future if an annual frequency vote becomes burdensome or otherwise proves to be less helpful than originally expected.
We will consider stockholders to have expressed a preference for the frequency that receives the largest number of favorable votes. Our Board of Directors also may from time to time decide that it is in the best interests of our company and its stockholders to hold the frequency vote more or less frequently than the non-binding option preferred by our stockholders.
Vote Required
Advisory approval of this proposal will require the affirmative vote of a majority of the votes cast on the proposal, assuming that a quorum is present at the Annual Meeting of Stockholders.
This proposal is advisory, and therefore not binding on our company, our Compensation Committee, or our Board of Directors. Although non-binding, the vote will provide information to our Compensation Committee and our Board of Directors regarding investor sentiment about our executive compensation philosophy, policies, and practices, which our Compensation Committee and our Board of Directors will be able to consider when making future executive compensation decisions.
We expect to conduct the next say-on-frequency vote at our 2023 Annual Meeting of Stockholders.
Board Recommendation
OUR BOARD OF DIRECTORS UNANIMOUSLY RECOMMENDS THAT STOCKHOLDERS VOTE “ONE YEAR” ON THE PROPOSAL TO DETERMINE THE FREQUENCY OF SAY-ON-PAY.
PROPOSAL FOUR:
RATIFICATION OF APPOINTMENT OF INDEPENDENT AUDITOR KPMG LLP, an independent registered public accounting firm, was the auditor for our fiscal year ended June 24, 2017.29, 2019. Our Audit Committee has appointed KPMG LLP to audit the consolidated financial statements of our company for our fiscal year ending June 30, 2018,27, 2020, and recommends a vote“for” the ratification of such appointment. In the event of a negative vote on such ratification, the Audit Committee will reconsider its selection. A representative of KPMG LLP is expected to attend the Annual Meeting of Stockholders, andStockholders. Such representative will have the opportunity to make a statement and will be available to respond to appropriate questions from shareholders.stockholders. The Audit Committee has considered whether the provision ofnon-audit services by KPMG LLP is compatible with maintaining KPMG LLP’s independence. Fees The aggregate fees billed to our company by KPMG LLP, for the fiscal years ended June 24, 201729, 2019 and June 25, 2016,30, 2018, were as follows: | | | | 2017 | | | 2016 | | | 2019 | | 2018 | Audit Fees | | $ | 2,452,000 | | | $ | 2,390,000 | | | $ | 2,590,000 | | | $ | 3,134,000 | | Audit-Related Fees(1) | | | 229,227 | | | | 25,000 | | | Tax Fees(2) | | | 642,012 | | | | 498,783 | | | Tax Fees(1) | | | | 477,730 | | | | 569,801 | | All Other Fees(2) | | | | 7,958 | | | | 38,135 | | | | | | | | | | | | | Total Fees | | $ | 3,323,239 | | | $ | 2,913,783 | | | $ | 3,075,688 | | | $ | 3,741,936 | | | | | | | | | | | | |
| (1) | Includes certain fees for acquisition diligence support for fiscal 2017. |
(2) | Includes fees for professional services rendered by KPMG LLP with respect to tax preparation and compliance, and tax due diligence for acquisition and tax consultation. The fees for tax due diligence support for fiscal 2017 were $149,876. The fees for tax consultation services were $123,970$261,271 and $96,311$295,983 for fiscal 20172019 and fiscal 2016,2018, respectively. |
| (2) | Includes fees for professional services rendered by KPMG LLP with respect to evaluation and compliance with the European Union General Data Protection Regulation. |
Audit CommitteePre-Approval Policies The charter of our Audit Committee provides that the duties and responsibilities of our Audit Committee include thepre-approval of all audit, audit-related, tax, and other services permitted by law or applicable SEC regulations (including fee and cost ranges) to be performed by our independent auditor. Anypre-approved services that will involve fees or costs exceedingpre-approved levels will also require specificpre-approval by the Audit Committee. Unless otherwise specified by the Audit Committee inpre-approving a service, thepre-approval will be effective for the12-month period followingpre-approval. The Audit Committee will not approve anynon-audit services prohibited by applicable SEC regulations or any services in connection with a transaction initially recommended by the independent auditor, the purpose of which may be tax avoidance and the tax treatment of which may not be supported by the Code and related regulations. To the extent deemed appropriate, the Audit Committee may delegatepre-approval authority to the Chairman of the Audit Committee or any one or more other members of the Audit Committee, provided that any member of the Audit Committee who has exercised any such delegation must report any suchpre-approval decision to the Audit Committee at its next scheduled meeting. The Audit Committee will not delegate to management thepre-approval of services to be performed by the independent auditor. Our Audit Committee requires that our independent auditor, in conjunction with our Chief Financial Officer, be responsible for seekingpre-approval for providing services to us and that any request forpre-approval must provide information to the Audit Committee about each service to be provided, and the details of such service. All of the services provided by KPMG LLP described above under the captions “Audit Fees,” “Audit-Related Fees,” and “Tax Fees,” and “All Other Fees” were approved by our Audit Committee pursuant to our Audit Committee’spre-approval policies. Ratification by Stockholders of the Appointment of our Independent Auditor Ratification of the appointment of KPMG LLP to audit the consolidated financial statements of our company for the fiscal year ending June 30, 2018,27, 2020, will require the affirmative vote of a majority of the votes cast on the proposal, assuming that a quorum is present at the Annual Meeting of Stockholders. PROPOSAL FIVE:FOUR: APPROVAL OF AN AMENDMENT TO THE AMENDED2019 EQUITY AND RESTATED 2010 INCENTIVE COMPENSATION PLAN We are askingAt the annual meeting, our stockholders will be asked to consideradopt and approve an amendmentthe Synaptics Incorporated 2019 Equity and Incentive Compensation Plan (the “Amendment”“2019 Incentive Plan”) to, which will replace the Company’sSynaptics Incorporated Amended and Restated 2010 Incentive Compensation Plan, as amended (the “2010 Plan”) to increase the share reserve of the “2010 Plan by 2,000,000 shares of our common stock. Our”, which together with the Synaptics Incorporated Amended and Restated 2001 Incentive Compensation CommitteePlan (the “2001 Plan”), we refer to as the “Predecessor Plans”). The Board approved the Amendment in2019 Incentive Plan on July 2017,30, 2019, subject to approval by our stockholders at the Annual Meeting of Stockholders.Meeting. If this Proposal Fivethe 2019 Incentive Plan is approved by our stockholders, the Amendmentit will becomebe effective uponas of the date of such approval, and no further grants will be made on or after such date under the Annual Meeting of Stockholders. In2010 Plan. Outstanding awards under the event that2010 Plan, however, will continue in effect in accordance with their terms. If the 2019 Incentive Plan is not approved by our stockholders, do not approve this Proposal Five,no awards will be made under the Amendment will not become effective2019 Incentive Plan, and the 2010 Plan will remain in effect.
Our Board of Directors believes Synaptics’ interests will be best advanced by stimulating the efforts of employees, officers,non-employee directors, and certain consultants of Synaptics and its subsidiaries, in each case, who are selected to be participants, by heightening the desire of such persons to continue in its current form. working toward and contributing to the success and progress of Synaptics. The Amendment will afford us2019 Incentive Plan allows for the continued ability to design compensatory awards that aregrant of stock options (including options intended to advancequalify as incentive stock options (“incentive stock options”) under Section 422 of the Internal Revenue Code of 1986, as amended (the “Code”) and options not intended to qualify as incentive stock options (“nonqualified stock options” and together with incentive stock options, “options”), appreciation rights (“SARs”), restricted stock, restricted stock units (“RSUs”), cash incentive awards, performance shares, performance units and other stock-based awards (collectively, “awards”), any of which may have vesting or other restrictions contingent on the achievement of management objectives (as described below). Our Board of Directors believes that the 2019 Incentive Plan will permit Synaptics to use stock-based compensation to further align the interests of 2019 Incentive Plan participants with those of our interests and long-term success by encouraging stock ownership among our officers, other employees, consultants and non-employee directors.stockholders. Why We Believe You Should Vote for Proposal Five As of August 18, 2017, 3,355,860 shares of common stock subject to outstanding awards were outstanding under the 2010 Plan and 2,350,950 shares remained available for issuance under the 2010 Plan.Four
We believe that our future success depends in part on our ability to attract, hire, motivate and retain high quality employees, consultantsdirectors and directorsconsultants and that the ability to provide equity awards under the 20102019 Incentive Plan is critical to achieving this success. We would be at a severe disadvantage if we could not use equity-based awards covering a meaningful number of shares to recruit and secure or retain key talent in the current competitive market for highly skilled and qualified employees. In addition, we use annual refresh grants to encourage workers to remain with us over a number of years, which provides continuity of institutional knowledge and minimizes the distractions and inefficiencies caused by employee turnover. We also believe that our future success depends in part on our ability to align the interests of our employees, consultantsdirectors and directorsconsultants with those of our stockholders, and that equity compensation is a key way to foster this alignment. Alignment comes in two key ways. First, the value our workers can realize from their equity compensation is based on our stock price performance. Second, we can use performance-based vesting to focus our workers on achieving specific goals that we believe are important to our success. We believe that equity compensation can help limit the cost to stockholders of our compensation programs, and can preserve cash for other uses in growing our business or returning value to our stockholders. If the Amendment2019 Incentive Plan is not approved, we may need to replace the lost compensation value with larger cash awards, which would increase our cash compensation expense. That cash that might be better utilized if reinvested in our business or returned to our stockholders. To help our stockholders better understand our historical equity compensation practices, currently anticipated needs, and an estimate of the potential cost of dilution from our request for additional shares, we note that, as of August 18, 2017:19, 2019: We have 33,732,827 | ● | | We have 32,910,891 shares of our common stock issued and outstanding; |
| ● | | We have 2,306,871 shares (7.0% of our issued and outstanding common stock) subject to outstanding unvested full value awards (214,757 of which were granted under the 2019 Inducement Plan); |
| ● | | We have 1,087,918 shares (3.3% of our issued and outstanding common stock) subject to outstanding stock options (76,625 of which were granted under the 2001 Plan), with a weighted average exercise price of $60.14 and an average remaining term of 1.7 years; |
| ● | | We have 3,026,331 shares available for future grant under the 2010 Plan, which number is reduced to 1,559,964 shares for full value awards after taking into account the 2010 Plan’s fungible share ratio of 1.94:1 (however, as noted above, no further grants will be made under the 2010 Plan upon the effective date of the |
We have 1,532,865 shares (4.5% of our issued and outstanding common stock) subject to outstanding unvested full value awards;
We have 2,490,019 shares (7.4% of our issued and outstanding common stock) subject to outstanding stock options and stock appreciation rights (667,024 of which were granted under our 2001 Incentive Compensation Plan), with a weighted average exercise price of $49.25 and an average remaining term of 2.0 years;
We have 2,350,950 shares available for future grant under the 2010 Plan;
The total number of shares of common stock subject to outstanding awards under the 2001 Plan and 2010 Plan (4,022,884 shares), plus the total number of shares available for future awards under the 2010 Plan (2,350,950 shares), represents a current overhang percentage of 18.9% (in other words, the potential dilution of our stockholders represented by the 2010 Plan, when viewed against our shares of common stock currently issued and outstanding, including shares of restricted stock);
We are asking for an additional 2,000,000 shares of common stock for future issuance under the 2010 Plan (which number is reduced to 1,030,927 shares after taking into account the fungible share ratio of 1.94) – this represents 3.1% of our issued and outstanding common stock if all shares are awarded as full value shares;
The total available pool, including the 2010 Plan (2,350,950 shares), plus the proposed additional shares available for future issuance under the 2010 Plan (2,000,000 shares), results in total potential new dilution of 6.6%, assuming all available awards are granted as full value shares with 1.94 fungible share ratio;
The total potential dilution following the share increase including shares available for future issuance under the 2010 Plan and currently outstanding awards under the 2001 Plan and 2010 Plan (4,022,884 shares) reflects a total potential dilution of 18.6% (assuming all available awards are granted as full value shares with 1.94 fungible share ratio); and
Based on the closing price of our common stock on the NASDAQ Global Select Market on August 18, 2017 of $40.36 per share, the aggregate market value as of that date of the 2,000,000 additional shares of common stock requested for issuance under the 2010 Plan was $80.7 million.
| 2019 Incentive Plan, so any of these shares then remaining will no longer be available for future awards upon the effectiveness of the 2019 Incentive Plan) and there are no shares available for future grant under the 2001 Plan. We will continue to grant equity and cash-based incentives in the ordinary course of business under the 2010 Plan until the 2019 Incentive Plan is approved by our stockholders; |
| ● | | The total number of shares of common stock subject to outstanding awards under the Predecessor Plans and the 2019 Inducement Plan (3,394,789 shares in total), plus the total number of shares available for future full value awards under the 2010 Plan (1,559,964 shares), represents a current overhang percentage of 15.1% (in other words, the potential dilution of our stockholders represented by the Predecessor Plans, when viewed against our shares of common stock currently issued and outstanding, including shares of restricted stock), however, as noted above, no grants will be made under the 2010 Plan after effectiveness of the 2019 Incentive Plan and any shares remaining available for grant under the 2010 Plan as of such date will no longer be available for awards under either plan; |
| ● | | We are asking for 1,660,000 shares of common stock available for awards under the 2019 Incentive Plan – this represents 5.0% of our issued and outstanding common stock, which percentage reflects the simple dilution of our stockholders that would occur if the 2019 Incentive Plan is approved; |
| ● | | The total shares of common stock subject to outstanding awards as of August 19, 2019 (3,394,789 shares), plus the proposed shares of common stock available for future issuance under the 2019 Incentive Plan (1,660,000 shares), represents potential dilution of 5,054,789 shares (approximately 15.4%); and |
| ● | | Based on the closing price of our common stock on the NASDAQ Global Select Market on August 19, 2019 of $34.68 per share, the aggregate market value as of that date of the 1,660,000 shares of common stock requested for issuance under the 2019 Incentive Plan was $57,568,800. |
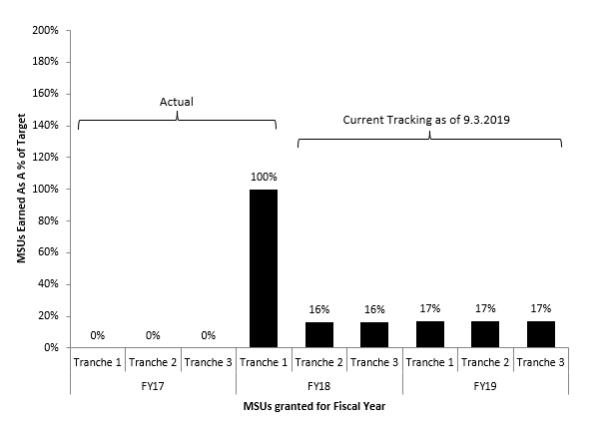
We recognize that our stockholders want to know about our recent grant practices, including our recent “burn rate,” when considering how to vote on our proposal to approve the 20102019 Incentive Plan. Burn rate or run rate (measuring a company’s annual usage of shares) is generally calculated as the number of shares granted divided by the weighted average number of shares outstanding and is used to demonstrate how quickly a company uses available shares. The table below provides our average aggregate three-year burn rate under the 2010 Plan and its predecessor plans. We note that for Russell 3000 companies in our GICS group (Semiconductor & Semi Equipment), the ISS benchmark burn rate as of February 1, 2017 is 7.66%. We believe that our recent annual burn rates, and our burn rate as compared to the ISS benchmark rate for 2017, demonstrate our commitment to sound equity compensation grant practices.Plan. | | | | | | | | | | | | | | | | | | | | | | | | | Fiscal Year | | Options
Granted | | | Restricted Stock
Awards/Units Granted
(excluding
Performance-Based) | | | Performance-Based
Restricted Stock
Awards/Units Earned | | | Total
Adjusted
Shares
Granted | | | Weighted Average
Shares at End of
Fiscal Year | | | Adjusted Burn
Rate | | 2015 | | | 526,665 | | | | 480,382 | | | | 93,424 | | | | 1,674,277 | | | | 36,900,000 | | | | 4.54 | % | 2016 | | | 440,362 | | | | 704,225 | | | | 103,199 | | | | 2,055,210 | | | | 36,600,000 | | | | 5.61 | % | 2017 | | | 356,107 | | | | 922,784 | | | | 10,339 | | | | 2,222,353 | | | | 34,800,000 | | | | 6.39 | % | | | | | | | | | | | | | | | | | | | | | | | | | | | | | Average Three-Year Burn Rate (2015-2017) | | | | | | | | 5.51 | % | | | | | | | | | | | | | | | | | | | | | | | | | |
| | | | | | | | | | | | | Fiscal Year | | Options
Granted | | Restricted Stock
Awards/Units
Granted (excluding
Performance-Based) | | Performance-Based
Restricted Stock
Awards/Units
Earned | | Total Shares
Granted | | Weighted Average
Shares at End of
Fiscal Year | | Burn Rate | 2017 | | 356,107 | | 922,784 | | 10,339 | | 1,289,230 | | 34,800,000 | | 3.70% | 2018 | | 61,825 | | 1,331,073 | | - | | 1,392,898 | | 34,200,000 | | 4.07% | 2019 | | - | | 1,263,966 | | 184,672 | | 1,448,638 | | 34,600,000 | | 4.19% | Average Three-Year Burn Rate (2017-2019) | | 3.99% |
In determining the number of shares to request for approval under the 20102019 Incentive Plan, our Compensation Committee consulted Compensia to review current market practices in the use of equity compensation. The Compensation Committee also considered other material factors, including our recent share usage, anticipated hiring needs in the next two years, the potential dilution (as noted in the figures above), our current focus on granting full value awards, (and therefore, the importanceelimination of the fungible share ratio),ratio from our 2019 Incentive Plan, our current stock price, recent experiences in the equity awards expected by new hire candidates, and general guidance from institutional proxy advisory firms such as ISS that our stockholders might consider in evaluating the 20102019 Incentive Plan. After reviewing this information, our Compensation Committee decided to request that our stockholders approve an additional 2,000,0001,660,000 shares to be added toas the 20102019 Incentive Plan’s share reserve. We currently anticipate that the shares requested, when combined with reserves currently available reserves,until effectiveness of the 2019 Incentive Plan, will provide for grants in the ordinary course of business for approximately two years. However, the proposed share reserve could last for a shorter or longer period of time, such as might be the case if equity compensation practices within our peer group changed and required us to alter our current grant practices to remain competitive, or if our stock price changes materially. As noted in “Summary of the 2010 Plan” below, and consistent with the terms of the 2010 Plan and market practices, our Compensation Committee will retain full discretion under the 2010 Plan to determine the form, terms, number and size of awards to be granted under the Plan, and future benefits that may be received by participants under the 2010 Plan are not determinable at this time. Responsible Plan Features When considering howOur Board of Directors believes the use of stock-based incentive awards promotes best practices in corporate governance by incentivizing the creation of stockholder value. By providing participants in the 2019 Incentive Plan with a stake in Synaptics’ success, the interests of the participants are further aligned with those of our stockholders. Specific features of the 2019 Incentive Plan that are consistent with commonly viewed good corporate governance practices include, but are not limited to:
| ● | | The 2019 Incentive Plan will be administered by the Compensation Committee of the Board, consisting entirely of independent directors; |
| ● | | Except for substitute awards in connection with a corporate transaction, options and SARs under the 2019 Incentive Plan may not be granted with exercise or base prices lower than the fair market value of the underlying shares on the grant date; |
| ● | | Except in connection with a corporate transaction or change in control, the 2019 Incentive Plan prohibits the repricing of options and SARs without stockholder approval, including no cancellation and replacement of any outstanding option or SAR with a new option, SAR, other award or cash or amendment or modification that reduces the exercise price of an option or base price of a SAR; |
| ● | | The 2019 Incentive Plan prohibits the grant of dividend equivalents with respect to options and SARs and subjects all dividends and dividend equivalents paid with respect to other awards to the same vesting conditions as the underlying shares subject to the awards; |
| ● | | The 2019 Incentive Plan prohibits “liberal share recycling” - meaning that shares used to pay the exercise price or withholding taxes relating to an award under the 2019 Incentive Plan will not be recycled back into the 2019 Incentive Plan for future grants; |
| ● | | The 2019 Incentive Plan prohibits, with certain limited exceptions, the vesting of awards earlier than after aone-year vesting or performance period, as applicable; |
| ● | �� | The 2019 Incentive Plan does not contain an evergreen feature; |
| ● | | The 2019 Incentive Plan does not contain a liberal change in control definition; and |
| ● | | Non-employee directors may not be awarded compensation for their service as a director having an aggregate maximum value on the grant date that exceeds an amount provided in the 2019 Incentive Plan during any calendar year. |
Plan Summary The following summary of the material terms of the 2019 Incentive Plan are qualified in their entirety by reference to votea copy of the 2019 Incentive Plan, which is set forth in Appendix B to this proxy statement. The 2019 Incentive Plan will become effective on this Proposal Five, we thinkthe date that it is approved by our stockholders should(the “Effective Date”). Following the Effective Date, no grants will be aware of the following key provisions ofmade under the 2010 Plan. AllPlan; however, outstanding awards granted under the 2010 Plan areand 2001 Plan will remain outstanding.Purpose.The purpose of the 2019 Incentive Plan is to provide a means through which Synaptics may attract and retain keynon-employee directors, officers, employees and certain consultants of Synaptics and its subsidiaries, and to provide to such persons incentives and rewards for service and/or performance. Eligibility.Non-employee directors, officers, employees, and consultants of Synaptics and its subsidiaries will be eligible for awards, as selected by the Committee (as defined below);provided,that, incentive stock options may be granted only to employees. As of August 19, 2019, we had eightnon-employee directors, 386 consultants and 1,834 employees who would be eligible to participate in the 2019 Incentive Plan, if selected by the Compensation Committee of the Board of Directors or such other committee designated by the Board of Directors (the “Committee”) or its delegate. A written agreement between Synaptics and each participant will evidence the terms of each award granted under the 2019 Incentive Plan. Number of Shares Authorized and Award Limit. Pursuant to the 2019 Incentive Plan, Synaptics has reserved an aggregate of 1,660,000 shares of common stock for issuance of awards of options or SARs, restricted stock, RSUs, performance shares or performance units, other awards permitted under the 2019 Incentive Plan, or dividend equivalents paid with respect to such awards, to be granted under the 2019 Incentive Plan. If any award granted under the 2019 Incentive Plan expires unexercised, is canceled, forfeited, settled in cash or unearned (in whole or in part), shares of our common stock subject to such award will again be made available for future grants under the 2019 Incentive Plan. Further, if any award granted under the Predecessor Plans expires unexercised, is canceled, forfeited, settled in cash or unearned (in whole or in part), shares of our common stock subject to such award will again be made available for future grants under the 2019 Incentive Plan. Use of shares of our common stock to pay the required exercise price, use of shares of our common stock with respect to havefull value awards, options or SARs to pay tax obligations, or shares not issued in connection with settlement of an option or SAR, or reacquired by Synaptics on the open market or otherwise using cash proceeds from the exercise of an option, will not be available again for other awards under the 2019 Incentive Plan. If a minimum one yearparticipant elects to give up the right to receive compensation in exchange for shares of common stock based on fair market value, such shares of common stock will not count against the aggregate limit of shares authorized under the 2019 Incentive Plan. Minimum Vesting Requirements and Individual Director Limit.In general, and subject to certain limitations, no award granted under the 2019 Incentive Plan may vest earlier than after aone-year vesting period except thator aone-year performance period, as applicable. However, up to 5% of the 2010sum of (i) the aggregate number of shares available for issuance as described above, and (ii) the number of shares returned to the 2019 Incentive Plan share reserveas a result of awards that are cancelled or forfeited, settled in cash, or unearned, may be subject togranted in the form of awards that do not meet suchone-year vesting requirements. Non-employee directors may not be granted compensation (including cash compensation) having an aggregate maximum value at the date of grant that exceeds $750,000 per calendar year. Administration.The 2010Committee will administer the 2019 Incentive Plan. Among other responsibilities, the Committee will select participants and determine the type of awards to be granted to participants, the number of shares of common stock to be covered by awards and the terms and conditions of awards, interpret the 2019 Incentive Plan establishesand awards granted thereunder, and make any other determination and take any other action that it deems necessary or desirable to administer the 2019 Incentive Plan. The Committee may delegate to its members, officers of Synaptics, or to agents or advisors, such administrative duties or powers as the Committee deems advisable, and the Committee, the subcommittee, or any other such person to whom duties or powers have been delegated, may employ persons to render advice with respect to a fungibleresponsibility of the Committee. The Committee may also, by resolution, authorize officers of Synaptics to designate employees to be recipients of awards and determine the size of such awards; provided, however, that (A) the Committee will not delegate such responsibilities to any such officer for awards granted to an employee who is an officer, director, or more than 10% “beneficial owner” (as defined in Rule13d-3 under the Securities Exchange Act of 1934, as amended, or the “Exchange Act”) of any class of Synaptics’ equity securities that is registered pursuant to Section 12 of the Exchange Act, determined by the Committee in accordance with Section 16 of the Exchange Act; (B) the resolution providing for such authorization will set forth the total number of common shares the officer may grant; and (C) the officer(s) will periodically report to the Committee regarding the nature and scope of such awards granted. Amendment or Termination. Unless earlier terminated, the expiration date of the 2019 Incentive Plan will be the tenth (10th) anniversary of the Effective Date;provided,however, that such expiration will not affect awards then outstanding, and the terms and conditions of the 2019 Incentive Plan will continue to apply to such awards. The Board of Directors may amend or terminate the 2019 Incentive Plan at any time;provided,that, an amendment will be subject to stockholder approval, and will not be effective without stockholder approval if, as determined by the Board of Directors, an amendment to the plan, for purposes of applicable stock exchange rules: 1) would materially increase the benefits accruing to participants; 2) would increase the number of securities which may be issued under the 2019 Incentive Plan; 3) would materially modify requirements for participation in the 2019 Incentive Plan; or 4) otherwise requires stockholder approval under applicable law or the rules of the applicable national securities exchange. Further, any such amendment that would impair the rights of any participant or any holder or beneficiary of any award granted under the 2019 Incentive Plan will not to that extent be effective without the consent of the affected participant, holder or beneficiary. Except in connection with a corporate transaction or change in control, none of the following actions can be taken under the 2019 Incentive Plan without approval of our stockholders: (i) amendment or modification to reduce the exercise price of any option or the base price of any SAR; (ii) cancel any outstanding option or SAR and replace it with a new option or SAR, other award or cash; or (iii) any other action that is considered a “repricing” for purposes of the stockholder approval rules of the NASDAQ Global Select Market. Options. The Committee may, in its discretion, grant incentive stock options and nonqualified stock options to participants.Non-employee directors, officers, employees, and consultants of Synaptics and its subsidiaries may be granted nonqualified stock options, but only employees of Synaptics and its subsidiaries may be granted incentive stock options. The Committee will determine the exercise price of options granted under the 2019 Incentive Plan. Subject to certain exceptions in connection with a corporate transaction, the exercise price of an incentive or nonqualified stock option will be at least 100% of the fair market value of the common stock subject to the option on the date the option is granted. The Committee will determine, in its sole discretion, the terms of each option. Options may not be exercisable for more than ten years from the date they are granted and will not provide for any dividends or dividend equivalents thereon. Acceptable consideration for the purchase of the common stock issued upon the exercise of an option will be specified in the award agreement and may include cash, check, cash equivalents and/or shares of common stock, a reduction in the number of shares deliverable upon exercise and such other forms of consideration that the Committee may accept. SARs. The Committee may, in its discretion, grant SARs to participants in the 2019 Incentive Plan. Generally, SARs permit a participant to exercise the right and receive a payment equal to the value of the common stock’s appreciation over a period of time in excess of the fair market value (the “base price”) of a share ratio of 1.94the common stock on the date of grant of the SAR. Synaptics may settle such amount in cash, in shares of our common stock valued at fair market value, or any combination thereof, as determined by the Committee and specified in the award agreement. SARs granted under the 2019 Incentive Plan will become exercisable and will expire in such manner and on such date(s) as determined by the Committee, with the term of the SAR not to exceed ten years from the grant date. The Committee will determine, in its sole discretion, the terms of each SAR. SARs granted under the 2019 Incentive Plan will not provide for any dividends or dividend equivalents thereon. Restricted Stock.The Committee may, in its discretion, grant restricted stock to participants in the 2019 Incentive Plan. The Committee will determine, in its sole discretion, the terms of each grant of restricted stock. Subject to the terms of the award, the recipients of restricted stock generally will have the rights and privileges of a stockholder with respect to the restricted stock, including the right to vote the stock, on the grant date. Dividends, if any, paid by Synaptics with respect to awards of restricted stock prior to the time all full valuerestrictions and vesting conditions on the restricted stock have lapsed will be withheld by the Committee and distributed to the participant in cash or shares of common stock upon the release of the restrictions applicable to the underlying shares of restricted stock. RSUs. The Committee may, in its discretion, grant RSUs to participants. An RSU is the right to receive shares of our common stock (or to the extent provided in the award agreement, cash or a combination of cash and common stock) following achievement of all vesting conditions and the lapse of all restrictions. The Committee will determine, in its sole discretion, the terms of each award of RSUs. Recipients of RSUs will not have the rights and privileges of a stockholder with respect to the common stock underlying such RSUs, including the right to vote the stock, until common stock in respect of the RSUs is actually issued to the participant following satisfaction of all vesting conditions. Dividends, if any, paid by Synaptics with respect to common stock underlying an award of RSUs prior to the time all restrictions and vesting conditions on the RSU have lapsed will be withheld by the Committee and distributed to the participant in cash or shares of common stock upon the release of the restrictions and vesting conditions applicable to the shares subject to the award. RSUs may be settled in shares of our common stock, cash or a combination thereof in the discretion of the Committee. Other Stock-Based Awards.The Committee, in its discretion, may award unrestricted shares of our common stock, or other awards denominated in shares of our common stock, to participants either alone or in tandem with other awards granted under the 20102019 Incentive Plan. The Committee will determine, in its sole discretion, the terms of each other stock-based award. Cash Incentive Awards, Performance Shares, and Performance Units.The Committee may, in its discretion, also grant performance shares, performance units and cash incentive awards to participants under the 2019 Incentive Plan. Each full value award share returninggrant will specify the number or amount of performance shares or performance units, or the amount payable with respect to cash incentive awards, which number or amount may be subject to adjustment to reflect changes in compensation or other factors. These awards, when granted under the 2019 Incentive Plan, become payable to participants upon the achievement of specified management objectives and upon such terms and conditions as the Committee determines at the time of grant. Each grant may specify, with respect to the reserve aftermanagement objectives, a minimum acceptable level of achievement and may set forth a formula for determining the effectivenumber of performance shares or performance units, or the amount payable with respect to cash incentive awards, that will be earned if performance is at or above the minimum or threshold level, or is at or above the target level but falls short of maximum achievement. Each grant will specify the time and manner of payment of cash incentive awards, performance shares or performance units that have been earned, and any grant may further specify that any such amount may be paid or settled in cash, shares of common stock, restricted stock, restricted stock units or any combination thereof. Any grant of performance shares may provide for the payment of dividend equivalents in cash or in additional shares of common stock, subject to deferral and payment on a contingent basis based on the participant’s earning of the performance shares with respect to which such dividend equivalents are paid. Each grant of performance shares, performance units or cash incentive awards will be evidenced by an award agreement which specifies the applicable terms and conditions of such award, including any vesting and forfeiture provisions. The performance period with respect to a cash incentive award, performance share, or performance unit will be a period of time determined by the Committee on the grant date. The performance period may be subject to earlier lapse or modification, including in the event of retirement, death or disability of the participant. Management Objectives.Management objectives are measurable performance objectives established under the 2019 Incentive Plan for participants who have received grants of performance shares, performance units or cash incentive awards or, when so determined by the Committee, options, SARs, restricted stock, RSUs, dividend equivalents or other awards granted under the 2019 Incentive Plan. If the Committee determines that a change in the business, operations, corporate structure or capital structure of Synaptics, or the manner in which it conducts its business, or other events or circumstances render the management objectives unsuitable, the Committee may in its discretion modify such management objectives or the acceptable levels of achievement, in whole or in part, as the Committee deems appropriate. Adjustments in Capitalization.In general, in the event of (1) any extraordinary cash dividend, stock dividend, stock split, combination of common stock, recapitalization or other change in the capital structure of Synaptics, (2) any merger, consolidation,spin-off,split-off,spin-out,split-up, reorganization, partial or complete liquidation or other distribution of assets, issuance of rights or warrants to purchase securities or (3) any other corporate transaction or event having an effect similar to any of the forgoing, necessary or appropriate equitable adjustments (as determined by the Committee) will be made, including, but not limited to, the number of shares of common stock or other securities of Synaptics (or number and kind of other securities, consideration or other property) that may be delivered in respect of awards or with respect to which awards may be granted under the 2019 Incentive Plan. In addition, in the event of a Change in Control (as defined within the 2019 Incentive Plan), the Committee may provide in substitution for any or all awards outstanding under the 2019 Incentive Plan such alternative consideration (including cash), if any, it in good faith may determine to be equitable in the circumstances and shall require in connection therewith the surrender of all awards so replaced. In connection with any of the foregoing events, the Committee may in its sole discretion elect to cancel outstanding options or SARs with an exercise price or base price that is equal to or less than the then current fair market value of our common stock without any consideration to the participant therefor. Change in Control.A Change in Control is defined in the 2019 Incentive Plan as the occurrence of any of the following events: | ● | | A change in control of a nature that would be required to be reported in response to Item 6(e) of Schedule 14A of Regulation 14A promulgated under the Exchange Act; |
| ● | | The following individuals no longer constitute a majority of the members of the Board of Directors: (1) the individuals who, as of the Effective Date, constitute the Board of Directors (the “Current Directors”); (2) the individuals who thereafter are elected to the Board of Directors and whose election, or nomination for election, to the Board of Directors was approved by a vote of a majority of all of the Current Directors then still in office (such directors becoming “Additional Directors” immediately following their election); and (3) the individuals who are elected to the Board of Directors and whose election, or nomination for election, to the Board of Directors was approved by a vote of a majority of all of the Current Directors and Additional Directors then still in office; |
| ● | | A tender offer or exchange offer is made whereby the effect of such offer is to take over and control Synaptics, and such offer is consummated for the equity securities of Synaptics representing more than 50% of the combined voting power of Synaptics’ then outstanding voting securities; |
| ● | | Following approval by the stockholders of Synaptics, Synaptics closes a reorganization, merger, consolidation or recapitalization of Synaptics, a reverse stock split of outstanding voting securities, or consummation of any such transaction if stockholder approval is not obtained, other than any such transaction that would result in more than 50% of the total voting power represented by the voting securities of the surviving entity outstanding immediately after such transaction being beneficially owned by the holders of outstanding voting securities of Synaptics immediately prior to the transaction, with the voting power of each such continuing holder relative to other such continuing holders not substantially altered in the transaction; |
| ● | | The consummation of a transaction approved by our stockholders of a plan of complete liquidation of Synaptics or an agreement for the sale or disposition by Synaptics of all or a substantial portion of Synaptics’ assets to another person, which is not a wholly owned subsidiary of Synaptics; or |
| ● | | Any “person” (as that term is used in Sections 13(d) and 14(d) of the Exchange Act) is or becomes the “beneficial owner” (as defined in Rule13d-3 of the Exchange Act), directly or indirectly of more than 50% of the total voting power represented by Synaptics’ then outstanding voting securities. |
In the event of a Change in Control: (i) unvested options and SARs will immediately vest, except to the extent that a replacement award (as such term is defined within the 2019 Incentive Plan) is provided; (ii) any restrictions, deferral of settlement and forfeiture conditions applicable to restricted stock, RSUs, or other awards that vest solely based on continued service (and not based on the achievement of management objectives) will lapse and be deemed fully vested, except to the extent that a replacement award is provided; (iii) with respect to cash incentive awards, performance shares, performance units, and other awards that are subject to the achievement of management objectives (other than with respect to awards described as “Market Stock Units”), the management objectives will be deemed satisfied at target, the applicable performance period will be deemed completed, and if no replacement award is provided, remaining restrictions, deferral of settlement and forfeiture conditions will lapse and the award will be deemed fully vested; and (iv) with respect to RSUs with management objectives described as “Market Stock Units,” a prorated portion of such units will vest based on the actual performance of the management objectives through the date of the 2010 Plan also counts as 1.94 shares. The 2010 Plan establishes a $750,000 limit onChange in Control, while the aggregate grant date fair value of compensatory equity awards that may be granted to any non-employee directorremainder of the CompanyMarket Stock Units will vest in any fiscal year.
accordance with their regular vesting schedule if a replacement award is provided, or if not, the remaining restrictions, deferral of settlement and forfeiture conditions will lapse and the Market Stock Units will be deemed fully vested.The 2010Clawback/Repayment. All awards granted under the 2019 Incentive Plan contains a clawback provision on performance-based awardsand held by each of the Company’sSynaptics’ executive officers that applieswill be subject to performance-based cash and equity compensationclawback, recoupment or forfeiture (i) to the extent that such executive officer is determined to have engagedengages in fraud or intentional illegal conduct that caused the Company’s material non-complianceresulted in Synaptics materiallynon-complying with any applicable financial reporting requirements and resulted in a financial restatement,misstatement; or (ii) to the result of which is that the amount received from such performance-based award would have been lower had it been calculated on the basis of such restated results. The clawback provision also provides for recovery of performance-based cash and equity compensationextent required by applicable laws, rules, regulations
or listing requirements. Additionally, all awards granted under the 20102019 Incentive Plan asare subject to recoupment to the extent necessary to comply with any clawback policy that Synaptics is required to adopt pursuant to applicable law or the listing standards of the applicable national securities exchange. Transferability. Awards under applicablethe 2019 Incentive Plan will generally not be transferable except by will or the laws rules, regulations or listing requirements. No Right to Continued Employment.The 20102019 Incentive Plan does not require automatic acceleration ongive any participant any right to be retained in the employ or service of Synaptics or any of its subsidiaries. Synaptics and its subsidiaries (as applicable) may at any time dismiss a changeparticipant from employment or discontinue any consulting relationship, free from any liability or any claim under the 2019 Incentive Plan.U.S. Federal Income Tax Consequences.The following is a brief summary of control. Instead,certain United States federal income tax consequences generally arising with respect to awards under the Board has the authority to negotiate in a transaction whether awards should be assumed, replaced, cancelled, cashed out or accelerated. The 2010 Plan2019 Incentive Plan. This discussion does not contain a liberal changeaddress all aspects of control definition. The 2010the United States federal income tax consequences of participating in the 2019 Incentive Plan provides that may be relevant to participants in light of their personal investment or tax circumstances and does not discuss any state, local ornon-United States tax consequences of participating in the exercise price2019 Incentive Plan. Each participant is advised to consult his or her personal tax advisor concerning the application of the United States federal income tax laws to such participant’s particular situation, as well as the applicability and effect of any state, local ornon-United States tax laws before taking any actions with respect to any awards.Incentive Stock Options. A participant who is granted an incentive stock optionsoption will not have federal income tax liability upon the grant of an incentive stock option and SARs generally must be no less thanwill not recognize regular taxable income when the incentive stock option is exercised. However, the participant will recognize alternative minimum taxable income equal to the excess of the fair market value of ourthe purchased shares at the time of exercise over the exercise price paid for those shares, if the participant is subject to the alternative minimum tax in the taxable year of the exercise. A participant generally will recognize income in the year in which the participant disposes of the shares purchased under such incentive stock option. If the participant makes a “qualifying disposition,” the participant will recognize a long-term capital gain equal to the excess of (i) the amount realized upon the sale or disposition over (ii) the exercise price paid for the shares and Synaptics cannot take an income tax deduction with respect to those shares. A qualifying disposition occurs when the participant’s sale or other disposition of the shares takes place (a) more than two (2) years after the grant date of the incentive stock option and (b) more than one (1) year after the date the option was exercised for the particular shares involved in the disposition. In contrast, a disqualifying disposition is any sale or other disposition made before both of these minimum holding periods are satisfied. Normally, when shares purchased under an incentive stock option are subject to a disqualifying disposition, the participant will recognize ordinary income at the time of the disposition in an amount equal to the excess of the lesser of (1) the amount realized upon that disposition and (2) the excess of the fair market value of the shares on the exercise date over the exercise price paid for those shares and Synaptics is entitled to an income tax deduction equal to the amount of ordinary income that the participant recognizes in connection with the disposition, subject to any applicable limitations under Section 162(m) of the Code. Nonqualified Stock Options. A participant who is granted a nonqualified stock option will not have federal income tax liability upon the grant of the nonqualified stock option, but will recognize ordinary income in the year in which the participant exercises the option in an amount equal to the excess of (i) the fair market value of the purchased shares on the exercise date over (ii) the exercise price paid for those shares and Synaptics will be entitled to an income tax deduction equal to the amount of ordinary income that the participant recognizes, subject to any applicable limitations under Section 162(m) of the Code. A participant will later also recognize a capital gain to the extent that the amount realized from the subsequent sale of the shares exceeds the participant’s basis in the shares. Appreciation Rights (SARs). A participant who is granted a SAR will not have federal income tax liability upon the grant of the SAR, but will recognize ordinary income in the year in which the participant exercises the SAR in an amount equal to the amount of the cash or the value of the stock that is transferred to the participant upon exercise of the SAR and Synaptics will be entitled to an income tax deduction equal to the amount of ordinary income that the participant recognizes, subject to any applicable limitations under Section 162(m) of the Code. Restricted Stock. A participant who is granted an award of restricted stock will recognize taxable income when the substantial risk of forfeiture of the shares lapses, i.e., at the time of “vesting,” unless the participant makes an election to be taxed at the time of grant. Assuming such an election is not made, the taxable income will be equal to the fair market value of the shares of restricted stock when they vest over the amount, if any, paid for those shares and Synaptics will be entitled to an income tax deduction equal to the amount of ordinary income that the participant recognizes, subject to any applicable limitations under Section 162(m) of the Code. The participant may elect under Section 83(b) of the Code to include as ordinary income in the year of the award an amount equal to the fair market value of the shares on the transfer date, less the amount, if any, paid for those shares. If the participant makes a Section 83(b) election, the participant will not recognize any additional income when the shares vest. If a Section 83(b) election is made, any appreciation in the value of the shares of restricted stock after the award is granted is not taxed as compensation but instead is taxed as a capital gain when the restricted shares are later sold or transferred. If the participant makes a Section 83(b) election and the restricted stock is later forfeited, the participant is not entitled to a tax deduction or a refund of the tax already paid. The Section 83(b) election must be filed with the Internal Revenue Service within thirty (30) days after the shares are awarded to the participant. Restricted Stock Units (RSUs). A participant who is granted a RSU generally will not recognize income when the RSU is granted or vested, but only when the RSU is settled. The participant will recognize ordinary income equal to the amount of the cash or the fair market value of the stock that the participant receives on settlement and Synaptics will be entitled to an income tax deduction equal to the amount of ordinary income that the participant recognizes, subject to any applicable limitations under Section 162(m) of the Code. Cash Incentive Awards, Performance Shares and Performance Units. No income generally will be recognized upon the grant of cash incentive awards, performance shares or performance units. Upon payment or settlement of cash incentive awards, performance shares or performance units, the recipient generally will be required to include as taxable ordinary income in the year of receipt an amount equal to the amount of cash received and the fair market value of anynon-restricted shares of common stock received and Synaptics will be entitled to an income tax deduction equal to the amount of ordinary income that the participant recognizes, subject to any applicable limitations under Section 162(m) of the Code. Section 162(m). Section 162(m) of the Code generally limits a public company’s ability to deduct compensation paid in excess of $1 million during any taxable year to certain “covered employees”, which includes a company’s chief executive officer, chief financial officer and each of its other named executive officers. If an individual is determined to be a covered employee for any year beginning after December 31, 2016, then that individual will continue to be a covered employee for future years, regardless of changes in the individual’s compensation or position. Withholding Taxes.To the extent Synaptics is required to withhold federal, state, local or foreign taxes in connection with any payment made or benefit realized by a participant or other person under the 2019 Incentive Plan, and the amounts available to Synaptics for such withholding are insufficient, it will be a condition to the receipt of such payment or the realization of such benefit that the participant or such other person make arrangements satisfactory to Synaptics for payment of the balance of such taxes required to be withheld, which arrangements, in the discretion of the Committee, may include relinquishment of a portion of such benefit. If a participant’s benefit is to be received in the form of shares of common stock, then, unless otherwise determined by the Committee, Synaptics will withhold, from the shares required to be delivered to the participant, shares of our common stock having a value equal to the amount required to be withheld under applicable law. In no event will the market value of the shares of our common stock to be withheld or delivered to Synaptics in order to satisfy applicable withholding taxes exceed the minimum amount of taxes required to be withheld unless: (i) an additional amount can be withheld and not result in adverse accounting consequences; (ii) such additional withholding amount is authorized by the Committee; and (iii) the total amount withheld does not exceed the participant’s estimated tax obligations attributable to the applicable transaction. The shares used for tax withholding will be valued at an amount equal to the market value of our common stock on the date the benefit is to be included in the participant’s income. New Plan Benefits. Other than the awards that may be granted under the 2019 Incentive Plan to our current President and CEO, Michael Hurlston, pursuant to his offer letter, the benefits that will be awarded or paid under the 2019 Incentive Plan are not currently determinable. Such awards are within the discretion of the Committee, and, other than with respect to Mr. Hurlston, the Committee has not determined future awards or who might receive them. Pursuant to Mr. Hurlston’s offer letter, he may be entitled to the following equity grants under either the 2010 Plan or the 2019 Incentive Plan, whichever is then in effect upon the applicable grant (as adjusted fordate: Refresh equity grant: Effective October 31, 2019, Mr. Hurlston will receive an amount of RSUs corresponding to a $1,500,000 equity value, a target amount of MSUs corresponding to a $1,500,000 equity value, and a target amount of PSUs corresponding to a $1,500,000 equity value (the “FY20 Refresh Grant”). The FY20 Refresh Grant will vest annually over three years subject to Mr. Hurlston’s continued employment with the Company through each vesting date and achievement of any changesapplicable performance conditions. Contingent equity grant: Effective as of that certain date upon which the acquisition of Finisar Corporation byII-VI Incorporated (the “Acquisition”) has closed, and if and only if the Acquisition has closed on or prior to November 9, 2019, Mr. Hurlston will receive an amount of RSUs corresponding to a $5,000,000 equity value and a target amount of MSUs corresponding to a $1,000,000 equity value (such grants, the “Contingent Equity Grant”). The Contingent Equity Grant will vest annually over four years subject to Mr. Hurlston’s continued employment with the Company through each vesting date and achievement of any applicable performance conditions. The dollar value and the approximate number of units in capitalization). The 2010 Plan prohibits the Board from undertaking a repricing of underwater options and stock appreciation rights (including cancelling for cash or exchanging for other awards) without stockholder approval.
The 2010 Plan does not provide for tax gross ups.
There are no options with “reload” rights outstanding under the 2010 Plan. | | | | | | Name and Position | | Dollar Value ($) | | Number of
Units | | Alex Wong, former Principal Executive Officer and current Senior Vice President of Worldwide Operations | | N/A | | N/A | | Kermit Nolan, Chief Accounting Officer and Interim Chief Financial Officer | | N/A | | N/A | | Richard Lu, Senior Vice President and General Manager, Mobile and Automotive Division | | N/A | | N/A | | Shawn Liu, Senior Vice President and General Manager, PC Division | | N/A | | N/A | | John McFarland, Senior Vice President, General Counsel and Secretary | | N/A | | N/A | | Richard A. Bergman, former Chief Executive Officer and President | | N/A | | N/A | | Wajid Ali, former Senior Vice President and Chief Financial Officer | | N/A | | N/A | | Huibert Verhoeven, former Senior Vice President & General Manager, Internet of Things Division | | N/A | | N/A | | All current executive officers as a group | | $10,500,000 | | 302,768 | | All currentnon-employee directors as a group | | N/A | | N/A | | All employees as a group, excluding executive officers | | N/A | | N/A |
Vote Required and Board Recommendation At the Annual Meeting, our stockholders will be requested to consider and approve the Amendment2019 Incentive Plan described in this Proposal Five.Four. The affirmative vote of a majority of the votes cast on this Proposal Four at the Annual Meeting is required for the adoption and approval of the Synaptics Incorporated 2019 Equity and Incentive Compensation Plan. Abstentions and brokernon-votes are not considered to be votes cast and, accordingly, will be required to approvehave no effect on the outcome of this Proposal Five.vote. OUR BOARD OF DIRECTORS UNANIMOUSLY RECOMMENDS THAT OUR STOCKHOLDERS VOTE FOR ADOPTION AND APPROVAL OF THE AMENDMENT TO THE AMENDEDSYNAPTICS INCORPORATED 2019 EQUITY AND RESTATED 2010 INCENTIVE COMPENSATION PLAN. Summary of the 2010 Plan
The material features of the 2010 Plan are outlined below. This summary is qualified in its entirety by reference to the complete text of the 2010 Plan, as amended by the Amendment. Stockholders are urged to read the actual text of the 2010 Plan, as amended by the Amendment in its entirety, which is appended to these proxy materials as Appendix B and may be accessed from the SEC’s website atwww.sec.gov.
Broad Based Plan
The 2010 Plan is designed to attract, motivate, retain, and reward our employees, directors, and consultants by providing such persons with cash and equity-based incentives to expend their maximum efforts in the creation of stockholder value. Under the 2010 Plan, we may grant stock options, stock appreciation rights, deferred stock units, restricted stock, bonus stock, dividend equivalents, other stock-related awards, and performance awards that may be settled in cash, stock, or other property. As of August 18, 2017, approximately 1,700 employees (including officers), seven non-employee directors and zero consultants were determined to be eligible for grants under the 2010 Plan.
Shares Available for Awards
A total of 2,350,950 shares of our Common Stock remain authorized for issuance under the 2010 Plan as of August 18, 2017. We are asking for an additional 2,000,000 shares of common stock for future issuance under the 2010 Plan. As of August 18, 2017:
There were a total of 33,732,827 shares of our common stock outstanding and the closing price per share on the NASDAQ Global Select Market was $40.36, for an aggregate market capitalization of $1.4 billion.
There were 2,350,950 shares immediately available for future grants under the 2010 Plan. 2,490,019 shares were subject to outstanding stock option awards, which options had an average exercise price of $49.25 and average remaining term of 2.0 years. 1,532,865 shares were subject to outstanding full value awards, of which 149,863 shares were subject to performance-based full value awards.
If any shares covered by an award granted under the 2010 Plan are forfeited, or if an award expires, terminates or is cancelled (other than by reason of exercise or vesting), then the shares covered by the award will again be available for grant under the 2010 Plan. Full value awards granted under the 2010 Plan will count as 1.94 shares for purposes of the share reserve, and shares subject to full value awards that are forfeited will be returned to the reserve as 1.94 shares.
Capitalization Adjustments
In the event that any dividend or other distribution, recapitalization, forward or reverse split, reorganization, merger, consolidation, spinoff, combination, repurchase, share exchange, liquidation, dissolution, or other similar corporate transaction or event affects our common stock, then the committee (as defined below) will substitute, exchange, or adjust any or all of the following in such manner as it deems equitable: (1) the kind and number of shares available under the 2010 Plan, (2) the kind and number of shares subject to limitations on awards described in the 2010 Plan (e.g., limitations imposed for compliance with Sections 162(m) and 421 of the Internal Revenue Code), (3) the kind and number of shares subject to all outstanding awards, (4) the exercise price, grant price, or purchase price relating to any award, and (5) any other affected terms of awards.
Administration
The 2010 Plan may be administered by the Board of Directors or a committee approved by our Board of Directors. Subject to the terms of the 2010 Plan, the plan administrator is authorized to select eligible persons to receive awards, determine the type and number of awards to be granted and the number of shares of our common stock to which awards will relate, specify times at which awards will be exercisable or may be settled (including performance conditions that may be required as a condition thereof), set other terms and conditions of awards, prescribe forms of award agreements, interpret and specify rules and regulations relating to the 2010 Plan, and make all other determinations that may be necessary or advisable for the administration of the 2010 Plan. The plan administrator may amend the terms of outstanding awards, in its discretion, subject, if necessary, to the consent of the recipient.
Stock Options and Stock Appreciation Rights
The plan administrator is authorized to grant stock options, including both incentive stock options and non-qualified stock options. Under U.S. tax law, incentive stock options may be granted only to our employees. Under the 2010 Plan, the maximum number of shares that may be issued on the exercise of incentive stock options is the lesser of the total share reserve and 15,000,000 shares. In addition, the plan administrator is authorized to grant stock appreciation rights, which entitle the
participant to receive the appreciation of our common stock between the grant date and the exercise date of the stock appreciation right. The plan administrator determines the exercise price per share subject to an option and the grant price of a stock appreciation right. In general, the per-share exercise price of an option or stock appreciation right must not be less than the fair market value of a share of our common stock on the grant date. The maximum term of each option or stock appreciation right may not exceed seven years. Options may be exercised by payment of the exercise price in any form of legal consideration specified by the plan administrator, including cash, shares (including net share settlement), outstanding awards, or other property having a fair market value equal to the exercise price. Options may also be exercisable in connection with a broker-assisted sales transaction (a “cashless” exercise) as determined by the plan administrator. The plan administrator determines the other terms of options and stock appreciation rights.
Restricted Stock and Deferred Stock Units
The plan administrator is authorized to grant restricted stock and restricted or deferred stock units. Restricted stock is a grant of shares of our common stock, which may not be sold or disposed of and which may be forfeited if the recipient’s service terminates or if he or she otherwise fails to vest in the shares. A participant granted restricted stock generally has all of the rights of one of our stockholders, unless otherwise determined by the plan administrator. An award of restricted or deferred stock units confers on a participant the right to receive shares of our common stock at the end of a specified period or upon achievement of performance goals. Prior to settlement, an award of stock units carries no voting or dividend rights or other rights associated with share ownership, although dividend equivalents may be granted. Stock units may be subject to vesting and may be forfeited if the recipient’s service terminates or if he or she otherwise fails to vest in the shares.
Dividend Equivalents
The plan administrator is authorized to grant dividend equivalents conferring on participants the right to receive, currently or on a deferred basis, cash, shares of our common stock, other awards, or other property equal in value to dividends paid on a specific number of shares of our common stock or other periodic payments. Dividend equivalents may be granted alone or in connection with another award, may be paid currently or on a deferred basis and, if deferred, may be deemed to have been reinvested in additional shares of our common stock, awards, or otherwise as specified by the plan administrator.
Bonus Stock and Awards in Lieu of Cash Obligations
The plan administrator is authorized to grant shares of our common stock as a bonus free of restrictions for services performed for us or to grant shares of our common stock or other awards in lieu of our obligations to pay cash under the 2010 Plan or other plans or compensatory arrangements, subject to such terms as the plan administrator may specify.
Performance Awards
The plan administrator may grant, pay or deliver performance awards, which represent a conditional right to receive cash, shares of our common stock, or other awards upon achievement of certain pre-established performance goals and subjective individual goals during a specified period generally related to our fiscal year or years. The plan administrator may, in its discretion, determine that the amount payable as a performance award will be reduced from the amount of any potential award. Partial achievement of the specified criteria may result in the payment or vesting corresponding to the degree of achievement as specified in the award agreement or the written terms of a performance award. In setting the performance goals, the plan administrator will specify whether the performance goal will be set on a GAAP or non-GAAP basis (if applicable). Nothing in the 2010 Plan requires the Company to grant awards that qualify as performance-based compensation for purposes of Section 162(m). The Company reserves the right to grant compensation that is not eligible for the exemption from the $1 million limitation imposed under Section 162(m). We believe it is in the best interest of the Company to have the flexibility to grant awards that qualify as performance-based compensation for purposes of Section 162(m).
Performance awards may include one or more of the following performance criteria: (1) total stockholder return, (2) such total stockholder return as compared to total return (on a comparable basis) of a publicly available index such as, but not limited to, the Standard & Poor’s 500 Stock Index, the S&P Specialty Retailer Index or the Philadelphia Semiconductor Index, (3) net income, (4) pretax earnings, (5) earnings before interest expense, taxes, depreciation and amortization, (6) pretax operating earnings after interest expense and before bonuses, service fees, and extraordinary or special items, (7) operating margin, (8) earnings per share, (9) return on equity, (10) return on capital, (11) return on investment, (12) operating earnings, (13) working capital or inventory, (14) operating earnings before the expense for share based awards and (15) ratio of debt to stockholders’ equity.
Other Stock Based Awards
The plan administrator is authorized to grant awards that are denominated or payable in, valued by reference to, or otherwise based on or related to shares of our common stock. Such awards might include convertible or exchangeable debt securities, other rights convertible or exchangeable into shares of our common stock, purchase rights for shares of our common stock, awards with value and payment contingent upon our performance or any other factors designated by the plan administrator, and awards valued by reference to the book value of shares of our common stock or the value of securities underlying our common stock or the performance of specified subsidiaries or business units.
Other Terms of Awards
Awards may be settled in the form of cash, shares of our common stock, other awards, or other property in the discretion of the plan administrator. Awards under the 2010 Plan are generally granted without a requirement that the participant pay consideration in the form of cash or property for the grant (as distinguished from an exercise pursuant to a grant of stock options), except to the extent required by law. The plan administrator may require or permit participants to defer the settlement of all or part of an award in accordance with such terms and conditions as the plan administrator may establish, including payment or crediting of interest or dividend equivalents on deferred amounts, and the crediting of earnings, gains, and losses based on deemed investment of deferred amounts in specified investment vehicles. The plan administrator is authorized to place cash, shares of our common stock, or other property in trusts or make other arrangements to provide for payment of our obligations under the 2010 Plan. The plan administrator may condition any payment relating to an award on the withholding of taxes and may provide that a portion of any shares of our common stock or other property to be distributed will be withheld (or previously acquired shares of our common stock or other property be surrendered by the participant) to satisfy withholding and other tax obligations. Awards granted under the 2010 Plan generally may not be pledged or otherwise encumbered and are not transferable except by will or by the laws of descent and distribution, or to a designated beneficiary upon the participant’s death, except that the plan administrator may, in its discretion, permit transfers of awards subject to any applicable legal restrictions.
Acceleration of Vesting; Change of Control
The 2010 Plan does not require automatic acceleration on a change of control transaction. We may require an acquiring or successor entity to assume or provide replacement awards for awards outstanding at the time of a transaction. Generally, if an award is not assumed or a replacement award granted, the underlying award will become fully vested, effective as of, and contingent upon, a change in control. With respect to market-based stock units (“MSUs”), the number of MSUs for any performance tranches that are ongoing as of the change in control (the “CIC MSUs”) will be determined based on actual achievement of the applicable performance criteria as of the day immediately prior to such change in control. A prorated portion of such CIC MSUs (based on the amount of time elapsed in the applicable performance tranche through the change in control) will become vested as of the change in control. The remaining portion of such CIC MSUs (the “Non-Vested CIC MSUs”) will remain outstanding after the change in control and will vest on the applicable vesting dates for such performance tranches, subject to the awardholder’s continued service. However, any Non-Vested CIC MSU that is not assumed or substituted by a successor or acquiring entity will become fully vested, effective as of, and contingent upon, a change in control.
The plan administrator, in its discretion, may accelerate the vesting, exercisability, lapsing of restrictions, or expiration of deferral of any award, including in the event we undergo a change of control. In addition, the plan administrator may provide that the performance goals relating to any performance-based award will be deemed to have been met upon the occurrence of any change of control. The award agreement may provide for the vesting of an award upon a change of control, including vesting if a participant is terminated by us or our successor without “cause” or terminates for “good reason,” as is defined in the 2010 Plan or in an agreement with the individual recipient, including as defined in our Change of Control Severance Policy for Principal Executive Officers and our Severance Policy for Principal Executive Officers.
No Repricing
The 2010 Plan prohibits our Board from undertaking actions that would be considered a repricing of underwater stock options and stock appreciation rights without the consent of our stockholders.
Minimum Vesting Requirements
Under the 2010 Plan, the Board generally must impose a minimum one year vesting period for stock awards. However, the Board may grant stock awards covering up to 5% of the sum of (i) the number of shares available for issuance under the 2010 Plan’s share reserve, plus (ii) the number of shares that are returned to the share reserve from time to time that do not meet such vesting requirements. Nothing in the 2010 Plan limits the Company’s ability to grant awards that contain rights to accelerated vesting on a termination of employment or service, or limit the Company’s powers at make adjustments to outstanding awards in the event of corporation transactions, including in connection with a change of control of the Company. In addition, if we acquire another entity, the Board may assume the compensatory equity awards of such entity, or grant substitute awards in respect of the target company’s awards, and as a result such assumed or substituted awards may not satisfy the minimum vesting criteria.
Limitations on Awards
The 2010 Plan has the following award limits:
An eligible person may not be granted awards relating to more than 1,000,000 shares of stock per fiscal year, subject to capitalization adjustment.
The maximum amount that may be earned pursuant to an annual incentive award or other cash award granted under the 2010 Plan in any fiscal year by any one participant is $2,000,000.
The maximum amount that may be earned as a performance award granted under the 2010 Plan in respect of a performance period by any one participant is $5,000,000.
No non-employee directors of the Board may be granted compensatory equity awards (under the 2010 Plan or any other stock plan of the Company) that have an aggregate grant date fair value that exceed $750,000 in any fiscal year.
Clawback Policy
All performance-based awards (cash and equity) held by the Company’s executive officers will be subject to clawback, recoupment or forfeiture (i) to the extent that such executive officer is determined to have engaged in fraud or intentional illegal conduct that caused the Company’s material non-compliance with any applicable financial reporting requirements and resulted in a financial restatement, the result of which is that the amount received from such performance-based award would have been lower had it been calculated on the basis of such restated results, or (ii) as required by applicable laws, rules, regulations or listing requirements. Such clawback, recoupment or forfeiture, in addition to any other remedies available under applicable law, may require the cancellation of outstanding awards and the recoupment of any gains realized with respect to awards. An executive officer may not claim the operation of the clawback as the basis for “good reason” to resign and receive severance benefits.
Amendment and Termination
Our Board of Directors may amend, alter, suspend, discontinue, or terminate the 2010 Plan or the committee’s authority to grant awards without further stockholder approval. We will seek stockholder approval of any material amendment of the 2010 Plan to the extent required by law or otherwise deemed necessary or desirable by our Board of Directors. Unless earlier terminated by our Board of Directors, the 2010 Plan will terminate on August 18, 2020, which is the tenth anniversary of the adoption by our Board of Directors of the Company’s 2010 Incentive Compensation Plan.
Federal Income Tax Consequences of Awards
The information set forth below is a summary only and does not purport to be complete. The information is based upon current federal income tax rules and therefore is subject to change if or when those rules change. Moreover, because the tax consequences to any recipient may depend on the recipient’s particular situation, each recipient should consult their own tax adviser regarding the federal, state, local, and other tax consequences of the grant or exercise of an award or the disposition of stock acquired as the result of an award. The 2010 Plan is not qualified under the provisions of Section 401(a) of the Code and is not subject to any of the provisions of the Employee Retirement Income Security Act of 1974. Subject to the requirement of reasonableness, the provisions of Section 162(m), and the satisfaction of a tax reporting obligation, we will generally be entitled to a tax deduction equal to the taxable ordinary income realized by a recipient on awards issued under the 2010 Plan. If the recipient of an award is our employee or an employee of one of our affiliates, any income recognized will be subject to employment taxes and withholding tax.
Nonqualified Stock Options
Generally, there is no taxation upon the grant of a nonqualified stock option if the option is granted with an exercise price per share equal to the fair market value of the underlying stock on the grant date. On exercise (including upon a broker-assisted or “cashless” exercise), an optionee will recognize ordinary income equal to the excess, if any, of the fair market value on the date of exercise of the stock received over the exercise price paid. If the optionee is our employee or an employee of one of our affiliates, that income will be subject to employment taxes and withholding tax.
Incentive Stock Options
An optionee generally is not subject to ordinary income tax upon the grant or exercise of an “incentive stock option” as defined in Section 422 of the Code. However, the exercise of an incentive stock option may result in alternative minimum tax liability. In addition, if the optionee holds a share received on exercise of an incentive stock option for at least two years from the date the option was granted and at least one year from the date the option was exercised (the “Required Holding Period”), the difference, if any, between the amount realized on a sale or other taxable disposition of that share and the holder’s tax basis in that share will be taxed as a long-term capital gain or loss.
If, however, an optionee disposes of a share acquired on exercise of an incentive stock option before the end of the Required Holding Period (a “Disqualifying Disposition”), the optionee generally will recognize ordinary income in the year of the Disqualifying Disposition equal to the excess, if any, of the fair market value of the share on the date the incentive stock option was exercised over the exercise price. However, if the sales proceeds are less than the fair market value of the share on the date of exercise of the option, the amount of ordinary income recognized by the optionee will not exceed the gain, if any, realized on the sale. If the amount realized on a Disqualifying Disposition exceeds the fair market value of the share on the date of exercise of the option, that excess will be short-term or long-term capital gain, depending on whether the holding period for the share exceeds one year.
Stock Awards
Generally, the recipient of a stock award will recognize ordinary income at the time the stock is received equal to the excess, if any, of the fair market value of the stock received over any amount paid by the recipient in exchange for the stock. Where no amount is paid for the stock, then the full fair market value of the stock received is ordinary income to the recipient. If, however, the stock is not vested when it is received (for example, if the stock is restricted stock and the employee is required to work for a period of time in order to have the right to sell the stock), the recipient generally will not recognize income until the stock becomes vested, at which time the recipient will recognize ordinary income equal to the excess, if any, of the fair market value of the stock on the date it becomes vested over any amount paid by the recipient in exchange for the stock. A recipient may, however, file an election with the Internal Revenue Service, within 30 days of the executive officer’s receipt of the stock award, to recognize ordinary income, as of the date the recipient receives the award, equal to the excess, if any, of the fair market value of the stock on the date the award is granted over any amount paid by the recipient in exchange for the stock.
Stock Appreciation Rights
Generally, there is no taxation upon the grant of a stock appreciation right if the right is granted with an exercise price equal to the fair market value of the underlying stock on the grant date. On exercise, the recipient will recognize ordinary income equal to the excess, if any, of the fair market value of the stock on the day the right is exercised over the strike price.
Deferred Stock Units
Generally, the recipient of deferred stock units will not recognize any income at grant and will recognize ordinary income at the time the stock is delivered equal to the excess, if any, of the fair market value of the shares of our common stock received over any amount paid by the recipient in exchange for the shares of our common stock.
New Plan Benefits
It is not possible to determine specific amounts and types of awards that may be awarded in the future under the 2010 Plan because the grant and actual pay-out of awards under the 2010 Plan are discretionary. The 2010 Plan does not mandate set benefits or amounts, and no awards have been granted under the 2010 Plan that are contingent on stockholder approval.
The following table shows, as to each Named Executive Officer and the various indicated groups, the number of shares of our common stock subject to stock options that have been granted (even if not currently outstanding) under the 2010 Plan since its initial approval by our stockholders in 2010 through August 18, 2017.
| | | | | | | Number of | | Name
| | Stock Options Granted | | Named Executive Officers:
| | | | | Richard A. Bergman, Chief Executive Officer & President
| | | 806,000 | | Wajid Ali, Senior Vice President and Chief Financial Officer
| | | 67,500 | | Kevin Barber, Senior Vice President & General Manager, Mobile Division
| | | 233,801 | | Huibert Verhoeven, Senior Vice President & General Manager, Internet of Things Division
| | | 55,942 | | Alex Wong, Senior Vice President, Worldwide Operations
| | | 109,162 | | All current executive officers as a group
| | | 1,389,561 | | All current non-employee directors as a group
| | | 722,227 | | Each nominee for election as a director:
| | | | | Francis F. Lee, Director
| | | 30,102 | | Nelson C. Chan, Director
| | | 27,102 | | Richard L. Sanquini, Director
| | | 28,602 | | Each associate of any of the foregoing
| | | — | | Each other person who received at least 5% of all options granted
| | | — | | All employees, excluding current executive officers
| | | 2,856,999 | |
Equity Compensation Plan Information For additional information on our equity compensation plans, including information about shares of our common stock that may be issued on exercise of options and warrants under all of our equity compensation plans as of June 24, 2017,30, 2019, please refer to the “Stock-Based Compensation Plan Information” section of this Proxy Statement. PROPOSAL FIVE: APPROVAL OF THE 2019 EMPLOYEE STOCK PURCHASE PLAN The Board of Directors of Synaptics Incorporated (“Synaptics”) adopted the Synaptics Incorporated 2019 Employee Stock Purchase Plan (the “2019 ESPP”) on July 30, 2019, subject to stockholder approval on or before the 12 month anniversary of such date. Our stockholders are now being asked to approve the 2019 ESPP, including the reservation of shares for issuance thereunder. The principal features and purpose of the 2019 ESPP are summarized below. If the 2019 ESPP is approved by our stockholders, it will replace our 2010 Employee Stock Purchase Plan (the “2010 ESPP”). Current offerings under the 2010 ESPP will remain in effect until the purchase date, but no further offerings will be made under the 2010 ESPP after approval by our stockholders of the 2019 ESPP. The following summary of the 2019 ESPP does not containpurport to be a complete description of all of the provisions of the 2019 ESPP and is qualified in its entirety by reference to the complete text of the 2019 ESPP, which is set forth in Appendix C to this proxy statement. Any stockholder who wishes to obtain a copy of the 2019 ESPP may do so upon written request to the Secretary at our principal executive offices. Summary of the 2019 ESPP Purpose. The purpose of the 2019 ESPP is to enable eligible employees of Synaptics (and certain of its subsidiaries and/or parents) to acquire a proprietary interest in the future of our company through the purchase of shares of common stock of Synaptics (“Common Stock”). The 2019 ESPP is intended to satisfy the requirements of an evergreen provision. “employee stock purchase plan” under Section 423 of the U.S. Internal Revenue Code of 1986 (the “Code” and such section, “Section 423”), although it provides for both Section 423 andnon-Section 423 components.Plan Administration. The 2019 ESPP provides that the 2019 ESPP shall be administered by the Compensation Committee of the Board of Directors of Synaptics (the “Board of Directors”) or such other committee or subcommittee of the Board of Directors duly appointed to administer the 2019 ESPP (the “Committee”), whose administration, interpretation and application of the 2019 ESPP and its terms will be final, conclusive and binding on all participants unless fraudulent or made in bad faith. The Committee may adopt one or moresub-plans applicable to particular subsidiaries of Synaptics or locations. Securities Subject to Plan. The 2019 ESPP provides for up to 1,500,000 shares of Common Stock (the “2019 ESPP Shares”) to be reserved for issuance pursuant to purchases made under the 2019 ESPP, subject to adjustment as provided for in the 2019 ESPP. These shares will be made available from Synaptics’ authorized but unissued or reacquired shares of Common Stock, shares of Common Stock purchased on the open market, or any combination thereof. If an outstanding purchase right for any reason expires or is terminated or canceled, the shares of Common Stock allocable to the unexercised portion of that purchase right shall again be available for issuance under the 2019 ESPP. The 2019 ESPP Shares represent approximately 4.6% of the total number of shares of Common Stock outstanding of 32,910,891 shares as of August 19, 2019. In establishing the 2019 ESPP Shares, our Board of Directors considered the potential dilutive impact to stockholders, the projected participation rate, and equity plan guidelines established by certain proxy advisory firms. Eligibility and Participation. Employees of Synaptics and certain of its subsidiaries or parents are eligible to participate in the 2019 ESPP if they have been employed by Synaptics (or by any subsidiary or parent designated for participation) for at least 1 month as of the first day of the offering period and they customarily work more than 20 hours per week for more than 5 months per calendar year. As of August 19, 2019, approximately 1,834 employees are eligible to participate in the 2019 ESPP, including seven officers of Synaptics. An employee will not be eligible to participate in the 2019 ESPP during an offering period to the extent that immediately after the grant of a purchase right, the employee (or any other person whose stock would be attributed to the employee under Section 424(d) of the Code) would own stock and/or hold outstanding purchase rights to purchase stock of Synaptics or any parent or subsidiary possessing 5% or more of the total combined voting power or value of all classes of stock of such corporation as determined in accordance with Section 423(b)(3) of the Code. Eligible employees become participants in the 2019 ESPP by delivering to the Company, prior to the applicable offering date, a subscription agreement. At the end of each offering period, each participant in the offering period will be automatically enrolled in the next succeeding offering period at the same withholding percentage unless the participant changes his or her elections, withdraws from the 2019 ESPP, or terminates employment or otherwise ceases to be an eligible employee. Offering Periods and Dates. Shares of Common Stock will be offered for purchase through a series of consecutive offering periods, each of which will generally be twelve months in duration, unless otherwise determined by the Committee; provided, however, that no offering period will have a duration exceeding 27 months. Unless otherwise adjusted pursuant to the 2019 ESPP, each offering period shall begin on March 16 or September 16, as applicable, immediately following the end of the previous offering period and ending on March 15 or September 15, as applicable. Each new offering period will commence, and the old offering period will terminate, on the first business day after a purchase date if the fair market value of a share of Common Stock is less than the fair market value of a share of Common Stock on the offering date of the offering period. For each offering period in which an employee participates, he or she will be granted a right to purchase Common Stock. Payroll Deductions. The purchase price of the shares is accumulated by payroll deductions from the employee’s compensation for the offering period. Each employee participating in the 2019 ESPP may elect to have up to 15% of regular cash compensation (subject to other limitations described in the 2019 ESPP) deducted on anafter-tax basis and credited to that employee’s account under the 2019 ESPP. An employee’s regular cash compensation generally includes base wages or salary, overtime, shift differentials, payments for paid time off and payment in lieu of notice. Except as otherwise determined by the Committee, cash compensation excludes variable compensation such as moving allowances, automobile allowances, payments pursuant to a severance agreement, termination pay, relocation payments, bonuses, commissions, finder’s fee, compensation deferred under any program or plan (including, without limitation, pursuant to Section 401(k) or Section 125 of the Code), any amounts directly or indirectly paid pursuant to the 2019 ESPP or any other stock purchase, stock option or other stock-based compensation plan, amounts paid pursuant to a pension plan or fringe benefit program by Synaptics or certain of its subsidiaries and/or parents, or any other extraordinary compensation not included above. Each employee participating in the 2019 ESPP may change the payroll deduction election one time during a purchase period, unless otherwise determined by the Committee. Payroll deductions will be credited to an account established in the employee’s name, shall be held as general assets of Synaptics and shall not accrue interest unless otherwise required by applicable law. To the extent that an employee’s payroll deductions exceed the amount required to purchase shares subject to purchase rights, the excess shall be carried forward to apply to the next purchase date if the employee’s participation in the 2019 ESPP continues and the excess is less than the amount that would have been necessary to purchase an additional whole share; otherwise, it will be refunded promptly after the purchase date to the employee without interest. Purchase of Common Stock; Exercise of Purchase Right. By electing to participate in the 2019 ESPP, each employee is in effect granted a right to purchase shares of Common Stock using payroll deductions accumulated as of each of the purchase dates for any offering period. However, no participant may (i) accrue rights to purchase stock with a value in excess of $25,000 (determined on the basis of the fair market value of the Common Stock on the start date of the offering period) in any calendar year; or (ii) purchase shares of Common Stock in excess of either the dollar limit (to the extent provided by the Committee) or the share limit applicable to an offering period. The share limit is 650 shares of Common Stock per6-month purchase period. The share limit may be adjusted by the Committee prior to the start of an offering period. If the total number of shares for which purchase rights are to be exercised on any purchase date exceeds the number of shares at the time available for issuance under the 2019 ESPP, then the Committee will prorate the available shares. An employee’s purchase right will be exercised by applying the amount credited to the employee’s account to the purchase of whole shares of Common Stock on each purchase date. If a balance remains in an employee’s account because it is less than the price of one whole share, it will be carried over to the next offering period, if the employee’s participation continues. Purchase Price of Common Stock;Taxes on the Acquisition or Disposition of Stock. On any particular purchase date under the 2019 ESPP, the purchase price per share will be established by the Committee; provided, however, that such purchase price shall not be less than 85% of the lower of (i) the fair market value of a share of Common Stock on the first business day in such offering period or (ii) the fair market value of a share of Common Stock on the last business day in such offering period. On August 19, 2019, the closing market price of Common Stock was $34.68, as reported by the NASDAQ Global Select Market. In general, the fair market value per share on any relevant date under the 2019 ESPP will be equal to: (i) if, on such date, Common Stock is listed on a national or regional securities exchange system, the closing price for the last preceding date quoted for such date by the principal exchange or trading market on which Common Stock is traded (as reported in theWall Street Journal or such other source as Synaptics deems reliable); (ii) if, on such date, Common Stock is not then listed on a national or regional securities exchange or quotation system, the average of the bid and asked prices per share of Common Stock for such day (as determined by the Committee), or, if it was not traded on such date, on the immediately preceding day on which Common Stock was traded; or (iii) if, on such date, the share of Common Stock cannot be valued pursuant to either (i) or (ii), the fair market value of a share of Common Stock will be determined in good faith by the Committee, consistent with applicable legal requirements. The participating employee shall be responsible for all taxes and generally all other withholdings required in connection with the acquisition or disposition of stock purchased under the 2019 ESPP. See “U.S. Federal Income Tax Information,” below. The participating employee shall not have an interest or voting right in any shares covered under the 2019 ESPP prior to purchase. Ability of the Committee to Amend or Terminate the 2019 ESPP. The Committee may amend or terminate the 2019 ESPP, or any purchase right granted thereunder, at any time, except that no such amendment or termination will affect purchase rights previously granted under the 2019 ESPP unless expressly provided for by the Committee and no such amendment or termination may materially adversely affect a purchase right without the consent of a participant (unless permitted by the 2019 ESPP or as required by applicable law or to qualify the 2019 ESPP pursuant to Section 423 of the Code). Certain amendments may require the approval of Synaptics’ stockholders. Unless the 2019 ESPP is earlier terminated, it will continue until the earlier of (i) the issuance of all Common Stock available for issuance under the 2019 ESPP or (ii) July 29, 2029. If the 2019 ESPP is terminated before an employee’s right to purchase shares has been exercised under the 2019 ESPP, any funds deducted from the employee’s compensation and credited to the employee’s account under the 2019 ESPP shall be refunded. Withdrawal. An employee may withdraw from the 2019 ESPP by delivering a cancellation notice to the company in accordance with the procedures prescribed by the company. Such cancellation notice must be delivered not later than 10 business days prior to the applicable purchase date to apply to that offering. An employee’s withdrawal from an offering does not affect the employee’s eligibility to participate in subsequent offerings under the 2019 ESPP. Termination of Employment. Termination of a participant’s continuous status as an employee for any reason, including retirement, death or disability, cancels his or her participation in the 2019 ESPP immediately. In such event, the payroll deductions credited to the employee’s account will be returned to the employee or, in the case of death, to the person or persons entitled thereto as specified by the employee in the written designation of beneficiary. Capital Changes. In the event any change is made in the capitalization of Synaptics, such as a merger, stock split, stock dividend, or any other material increase or decrease in the shares of Synaptics stock without the company’s receipt or payment of consideration, appropriate adjustments will be made to (i) the maximum number and class of securities issuable under the 2019 ESPP, (ii) the maximum number of securities purchasable per participant during an offering and (iii) the number and class of securities and the price per share in effect under each outstanding purchase right. Such adjustments will prevent any dilution or enlargement of the rights and benefits of plan participants. In the event of a change in control of Synaptics, the Board of Directors (or the Committee) may provide for any of, or a combination of, any of the following: (i) each purchase right will be assumed or an equivalent purchase right will be substituted by the surviving entity; (ii) a date selected by the Board of Directors (or the Committee) on or before the date of consummation of the change in control will be treated as a purchase date and all outstanding purchase rights will be exercised on such date; (iii) all outstanding purchase rights will terminate and the accumulated payroll deductions will be refunded to each participant upon or immediately prior to the change in control; or (d) outstanding purchase rights will continue unchanged. Nonassignability. No rights or accumulated payroll deductions of an employee under the 2019 ESPP may be pledged, assigned or transferred for any reason, and any such attempt may be treated by Synaptics as an election to withdraw from the 2019 ESPP. Reports. Individual accounts are maintained for each participant in the 2019 ESPP. After each purchase date, the participant’s broker account will update with the number of shares purchased on behalf of the participant and the purchase price paid per share. The participant will also receive an annual statement of his or her plan account. Compliance with Securities Law. The issuance of shares under the 2019 ESPP shall be subject to compliance with all applicable requirements of federal, state and foreign law with respect to such securities and the requirements of any stock exchange upon which the shares may then be listed and will be further subject to the approval of counsel for Synaptics with respect to such compliance. U.S. Federal Income Tax Information. The 2019 ESPP is intended to qualify under the provisions of Sections 421 and 423 of the Code. Under these provisions, no income will be taxable to a participant at the time of grant of the right to purchase, or the actual purchase of, shares. However, upon the employee’s disposition of shares purchased under the 2019 ESPP, the participant will generally be subject to tax. Upon disposition, if the shares have been held by the participant for more than two years after the first day of the offering period and more than one year after the purchase date of the shares, the participant will recognize taxable ordinary income equal to the lesser of (i) the excess of the fair market value of the shares at the time of the disposition over the purchase price of the shares, or (ii) 15% of the fair market value of the shares on the first day of the applicable offering period. Any additional taxable gain on the disposition will be treated as a long-term capital gain. If the shares are disposed of before the expiration of the holding periods described above, the excess of the fair market value of the shares on the purchase date over the purchase price will be taxable as ordinary income, and any gain or loss on such disposition will be treated as a capital gain or loss. The company is not entitled to a deduction for amounts taxable to a participant, except to the extent of ordinary income reported by the participant on disposition of shares before the expiration of the holding periods described above. The foregoing is only a summary of the United States federal income tax consequences of the 2019 ESPP to participants and does not purport to be complete. Reference should be made to the applicable provisions of the Code. In addition, the summary does not discuss the income tax consequences of a participant’s death or the income tax laws of any municipality, state or foreign country in which the participant may reside, and to which the participant may be subject. Restriction on Resale. Certain officers and directors of Synaptics may be deemed to be “affiliates” of the company, as that term is defined under the Securities Act of 1933. Common Stock acquired under the 2019 ESPP by an affiliate may only be reoffered or resold pursuant to an effective registration statement or pursuant to Rule 144 under the Securities Act or another exemption from the registration requirements of the Securities Act of 1933. New Plan Benefits. Because benefits under the 2019 ESPP will depend on employees’ elections to participate and the fair market value of Common Stock at various future dates, it is not possible to determine the benefits that will be received by executive officers and other employees if the 2019 ESPP is approved by the stockholders.Non-employee directors are not eligible to participate in the 2019 ESPP. Vote Required and Board Recommendation At the Annual Meeting, our stockholders will be requested to consider and approve the 2019 Employee Stock Purchase Plan described in this Proposal Five. The 2019 Employee Stock Purchase Plan will be approved if it receives the affirmative vote of a majority of the total votes cast in this Proposal Five at the annual meeting. Abstentions and brokernon-votes are not considered to be votes cast and, accordingly, will have no effect on the outcome of this vote. OUR BOARD OF DIRECTORS UNANIMOUSLY RECOMMENDS THAT OUR STOCKHOLDERS VOTE FOR APPROVAL OF THE 2019 EMPLOYEE STOCK PURCHASE PLAN. Equity Compensation Plan Information For additional information on our equity compensation plans, including information about shares of our common stock that may be issued on exercise of options and warrants under all of our equity compensation plans as of June 30, 2019, please refer to the “Stock-Based Compensation Plan Information” section of this Proxy Statement. DEADLINE FOR RECEIPT OF STOCKHOLDER PROPOSALS Stockholder proposals that are intended to be considered for inclusion in our Proxy Statement and form of proxy relating to our Annual Meeting of Stockholders for the fiscal year ending June 30, 2018,27, 2020, pursuant to Rule14a-8 under the Exchange Act (“Rule14a-8”) must be received by us at our executive offices set forth in this Proxy Statement no later than May 15, 2018,13, 2020, and must otherwise comply with Rule14a-8. Any stockholder proposals received outside of the Rule14a-8 procedure for consideration at our Annual Meeting of Stockholders for the fiscal year ending June 30, 2018,27, 2020, must be received by us at our executive offices set forth in this Proxy Statement no earlier than July 3, 2018,1, 2020, and no later than August 2, 2018.July 31, 2020. In addition to the timely notice requirements, stockholder proposals (including proposals for nominees for directors) must include the information required by our bylaws and comply with the other applicable procedures described therein. Furthermore, stockholder proposals must comply with all applicable requirements of the Exchange Act and the rules and regulations thereunder. The time limits noted above also apply in determining whether notice is timely for purposes of rules adopted by the SEC relating to the exercise of discretionary voting authority. OTHER MATTERS We know of no other matters to be submitted to the 20172019 Annual Meeting of Stockholders. If any other matters properly come before the meeting, it is the intention of the persons named in the enclosed proxy card to vote the shares they represent as our Board of Directors may recommend. Dated: September 12, 201710, 2019 [THIS PAGE INTENTIONALLY LEFT BLANK]
APPENDIX A NON-GAAP FINANCIAL INFORMATION In evaluating our business, we consider and use (i) operating incomeincome/(loss) excluding certain non-cash or non-recurring items such as acquisition and integration related costs (including changes in contingent consideration, amortization of certain acquired intangible assets and legal and consulting costs), share-based compensation charges, loss on supply commitment charges, litigation settlement charges,charge, restructuring costs, retention costs, CEO severance costs, impairment of intangible assets, foreign currency adjustments,non-cash interest on convertible debt, other items, net (includingnon-cash interest, net, arbitration costs, equity investment loss, acquisition related severance costs and gainimpairment recovery on the saleinvestments), and tax adjustments as a supplemental measure of a building,operating performance, ornon-GAAP operating income, (ii) operating marginmargin/(loss) excluding certain non-cashrecurring ornon-recurring items such as acquisition and integration related costs (including changes in contingent consideration, amortization of certain acquired intangible assets and legal and consulting costs), share-based compensation charges, loss on supply commitment charges, litigation settlement charges,charge, restructuring costs, retention costs, impairment of intangible assets, foreign currency adjustments, and gainother items, net (includingnon-cash interest, net, arbitration costs, equity investment loss, acquisition related severance costs and impairment recovery on the sale of a building,investments) , as a percentage of total revenue, ornon-GAAP operating margin, (iii) net incomeincome/(loss) excluding certain acquisition and integration related costs (including changes in contingent consideration, amortization of certain acquired intangible assets and legal and consulting costs), share-based compensation, loss on supply commitment charges, litigation settlement charges,charge, restructuring costs, retention costs, CEO severance costs, impairment of intangible assets, foreign currency adjustments,non-cash interest on convertible debt, other items, net (includingnon-cash interest, net, arbitration costs, equity investment loss, acquisition related severance costs and impairment recovery on investments), and tax adjustments as a supplemental measure of operating performance, ornon-GAAP net income, and (iv) net incomeincome/(loss) per diluted share diluted excluding certain acquisition and integration related costs (including changes in contingent consideration, amortization of certain acquired intangible assets and legal and consulting costs), share-based compensation charges, loss on supply commitment charges, litigation settlement charges,charge, restructuring costs, retention costs, CEO severance costs, impairment of intangible assets, foreign currency adjustments,non-cash interest on convertible debt, other items, net (includingnon-cash interest, net, arbitration costs, equity investment loss, acquisition related severance costs and impairment recovery on investments), and tax adjustments as a supplemental measure of operating performance, ornon-GAAP net income per diluted share, diluted, as supplemental measures of operating performance, including the use ofnon-GAAP operating income for purposes of the financial performance measures used in our annual performance-based cash bonus plan.Non-GAAP operating income,non-GAAP operating margin,non-GAAP net income, andnon-GAAP net income per share are not measurements of our financial performance under GAAP and should not be considered as an alternative to GAAP operating income,income/(loss), GAAP operating margin,margin/(loss), GAAP net income,income/(loss), and GAAP net incomeincome/(loss) per share, respectively. We presentnon-GAAP operating income,non-GAAP operating margin,non-GAAP net income, andnon-GAAP net income per share because we consider them an important supplemental measure of our performance. We believe these measures facilitate operating performance comparisons from period to period by eliminating potential differences in operating income,income/(loss), operating margin,margin/(loss), net income,income/(loss), and net incomeincome/(loss) per share caused by the existence and timing of certain non-cashrecurring ornon-recurring items such as certain acquisition and integration related costs (including changes in contingent consideration, amortization of certain acquired intangible assets and legal and consulting costs), share-based compensation charges, loss on supply commitment charges, litigation settlement charges,charge, restructuring costs, retention costs, CEO severance costs, impairment of intangible assets, foreign currency adjustments, gainnon-cash interest on sale of building,convertible debt, other items, net (includingnon-cash interest, net, arbitration costs, equity investment loss, acquisition related severance costs and impairment recovery on investments), and tax adjustments.Non-GAAP operating income,non-GAAP operating margin,non-GAAP net income, andnon-GAAP net income per share have limitations as analytical tools and should not be considered in isolation or as substitutes for our GAAP operating income,income/(loss), GAAP operating margin,margin/(loss), GAAP net income,income/(loss), or GAAP net incomeincome/(loss) per share. The principal limitations of these measures are that they do not reflect our actual expenses and may thus have the effect of inflating our GAAP operating income,income/(loss), GAAP operating margin,margin/(loss), GAAP net income,income/(loss), and GAAP net incomeincome/(loss) per share. The following is a reconciliation of the differences between GAAP andnon-GAAP operating income,income/(loss), operating margin,margin/(loss), net income,income/(loss), and net incomeincome/(loss) per share for the periods indicated: | | | | | | | | | | | | | | | | | | | | | | | | Fiscal Years Ended June 30, | | | | | 2013 | | | 2014 | | | 2015 | | | 2016 | | | 2017 | | | | | (in millions, except per share amounts) | | GAAP Operating income | | $ | 100.7 | | | $ | 72.5 | | | $ | 162.2 | | | $ | 75.2 | | | $ | 64.7 | | GAAP operating margin | | | 15.2 | % | | | 7.6 | % | | | 9.5 | % | | | 4.5 | % | | | 3.8 | % | Acquisition and integration related costs(1) | | | 2.4 | | | | 83.6 | | | | 78.6 | | | | 72.5 | | | | 60.6 | | Share-based compensation charge | | | 32.2 | | | | 32.9 | | | | 44.1 | | | | 56.8 | | | | 61.8 | | Litigation settlement charge | | | — | | | | — | | | | — | | | | — | | | | 10.0 | | Restructuring costs | | | — | | | | — | | | | — | | | | 8.6 | | | | 7.3 | | Impairment of intangible assets | | | — | | | | — | | | | — | | | | 6.7 | | | | — | | Foreign currency adjustments(2) | | | — | | | | — | | | | (15.4 | ) | | | — | | | | — | | Gain on sale of building | | | (1.6 | ) | | | — | | | | — | | | | — | | | | — | | | | | | | | | | | | | | | | | | | | | | | Non-GAAP operating income | | $ | 133.7 | | | $ | 189.0 | | | $ | 269.5 | | | $ | 219.8 | | | $ | 204.4 | | | | | | | | | | | | | | | | | | | | | | | Non-GAAP operating margin | | | 20.1 | % | | | 19.9 | % | | | 15.8 | % | | | 13.2 | % | | | 11.9 | % | GAAP net income | | $ | 98.9 | | | $ | 46.7 | | | $ | 110.4 | | | $ | 72.2 | | | $ | 48.8 | | Acquisition and integration related costs(1) | | | 2.4 | | | | 83.6 | | | | 78.6 | | | | 72.5 | | | | 60.6 | | Share-based compensation | | | 32.2 | | | | 32.9 | | | | 44.1 | | | | 56.8 | | | | 61.8 | | Litigation settlement charge | | | — | | | | — | | | | — | | | | — | | | | 10.0 | | Restructuring costs | | | — | | | | — | | | | — | | | | 8.6 | | | | 7.3 | | Impairment of intangible assets | | | — | | | | — | | | | — | | | | 6.7 | | | | — | | Foreign currency adjustments(2) | | | — | | | | — | | | | (15.4 | ) | | | — | | | | — | | Other items, net | | | (1.8 | ) | | | (1.1 | ) | | | (0.9 | ) | | | (2.7 | ) | | | (0.8 | ) | Tax adjustments | | | (25.3 | ) | | | (4.5 | ) | | | 4.5 | | | | (33.6 | ) | | | (13.8 | ) | | | | | | | | | | | | | | | | | | | | | | Non-GAAP net income | | $ | 106.4 | | | $ | 157.6 | | | $ | 221.3 | | | $ | 180.5 | | | $ | 173.9 | | | | | | | | | | | | | | | | | | | | | | | GAAP net income per share — diluted | | $ | 2.89 | | | $ | 1.26 | | | $ | 2.84 | | | $ | 1.91 | | | $ | 1.37 | | Acquisition and integration related costs(1) | | | 0.07 | | | | 2.25 | | | | 2.02 | | | | 1.91 | | | | 1.70 | | Share-based compensation | | | 0.94 | | | | 0.89 | | | | 1.13 | | | | 1.50 | | | | 1.74 | | Litigation settlement charge | | | — | | | | — | | | | — | | | | — | | | | 0.28 | | Restructuring costs | | | — | | | | — | | | | — | | | | 0.23 | | | | 0.21 | | Impairment of intangible assets | | | — | | | | — | | | | — | | | | 0.18 | | | | — | | Foreign currency adjustments(2) | | | — | | | | — | | | | (0.40 | ) | | | — | | | | — | | Other items, net | | | (0.06 | ) | | | (0.03 | ) | | | (0.02 | ) | | | (0.07 | ) | | | (0.03 | ) | Tax adjustments | | | (0.73 | ) | | | (0.12 | ) | | | 0.12 | | | | (0.90 | ) | | | (0.39 | ) | | | | | | | | | | | | | | | | | | | | | | Non-GAAP net income per share — diluted | | $ | 3.11 | | | $ | 4.25 | | | $ | 5.69 | | | $ | 4.76 | | | $ | 4.88 | | | | | | | | | | | | | | | | | | | | | | |
| | | | | | | | | | | | | | | | | | | | | | | | Fiscal Years Ended June 30, | | | | | 2015 | | | 2016 | | | 2017 | | | 2018 | | | 2019 | | | | | (in millions, except per share amounts) | | GAAP Operating income /(loss) | | $ | 162.2 | | | $ | 75.2 | | | $ | 64.7 | | | $ | (61.9) | | | $ | (6.3) | | GAAP operating margin/(loss) | | | 9.5% | | | | 4.5% | | | | 3.8% | | | | -3.8% | | | | -0.4% | | Acquisition and integration related costs(1) | | | 78.6 | | | | 72.5 | | | | 60.6 | | | | 136.0 | | | | 77.3 | | Share-based compensation charge | | | 44.1 | | | | 56.8 | | | | 61.8 | | | | 71.3 | | | | 59.0 | | Loss on supply commitment | | | - | | | | - | | | | - | | | | - | | | | 9.0 | | Litigation settlement charge | | | - | | | | - | | | | 10.0 | | | | - | | | | - | | Restructuring costs | | | - | | | | 8.6 | | | | 7.3 | | | | 12.0 | | | | 17.7 | | Retention costs | | | - | | | | - | | | | - | | | | - | | | | 2.5 | | Impairment of intangible assets | | | - | | | | 6.7 | | | | - | | | | - | | | | - | | Foreign currency adjustments(2) | | | (15.4) | | | | - | | | | - | | | | - | | | | - | | Other items, net(3) | | | - | | | | - | | | | - | | | | 4.4 | | | | (1.7) | | | | | | | | | | | | | | | | | | | | | | | Non-GAAP operating income | | $ | 269.5 | | | $ | 219.8 | | | $ | 204.4 | | | $ | 161.8 | | | $ | 159.7 | | | | | | | | | | | | | | | | | | | | | | | Non-GAAP operating margin | | | 15.8% | | | | 13.2% | | | | 11.9% | | | | 9.9% | | | | 10.8% | | | | | | | | GAAP net income/(loss) | | $ | 110.4 | | | $ | 72.2 | | | $ | 48.8 | | | $ | (124.1) | | | $ | (22.9) | | Acquisition and integration related costs(1) | | | 78.6 | | | | 72.5 | | | | 60.6 | | | | 136.0 | | | | 77.3 | | Share-based compensation | | | 44.1 | | | | 56.8 | | | | 61.8 | | | | 71.3 | | | | 59.0 | | Loss on supply commitment | | | - | | | | - | | | | - | | | | - | | | | 9.0 | | Litigation settlement charge | | | - | | | | - | | | | 10.0 | | | | - | | | | - | | Restructuring costs | | | - | | | | 8.6 | | | | 7.3 | | | | 12.0 | | | | 17.7 | | Retention costs | | | - | | | | - | | | | - | | | | - | | | | 2.5 | | CEO severance | | | - | | | | - | | | | - | | | | - | | | | 2.2 | | Impairment of intangible assets | | | - | | | | 6.7 | | | | - | | | | - | | | | - | | Foreign currency adjustments(2) | | | (15.4) | | | | - | | | | - | | | | - | | | | - | | Non-cash interest on convertible debt | | | - | | | | - | | | | - | | | | 17.4 | | | | 17.6 | | Other items, net(4) | | | (0.9) | | | | (2.7) | | | | (0.8) | | | | 7.6 | | | | (2.3) | | Tax adjustments | | | 4.5 | | | | (33.6) | | | | (13.8) | | | | 21.2 | | | | (18.9) | | | | | | | | | | | | | | | | | | | | | | | Non-GAAP net income | | $ | 221.3 | | | $ | 180.5 | | | $ | 173.9 | | | $ | 141.4 | | | $ | 141.2 | | | | | | | | | | | | | | | | | | | | | | | | | | | | | GAAP net income/(loss) per share - diluted | | $ | 2.84 | | | $ | 1.91 | | | $ | 1.37 | | | $ | (3.63) | | | $ | (0.66) | | Acquisition and integration related costs(1) | | | 2.02 | | | | 1.91 | | | | 1.70 | | | | 3.98 | | | | 2.23 | | Share-based compensation | | | 1.13 | | | | 1.50 | | | | 1.74 | | | | 2.07 | | | | 1.71 | | Loss on supply commitment | | | - | | | | - | | | | - | | | | - | | | | 0.26 | | Litigation settlement charge | | | - | | | | - | | | | 0.28 | | | | - | | | | - | | Restructuring costs | | | - | | | | 0.23 | | | | 0.21 | | | | 0.34 | | | | 0.51 | | Retention costs | | | - | | | | - | | | | - | | | | - | | | | 0.07 | | CEO severance | | | - | | | | - | | | | - | | | | - | | | | 0.06 | | Impairment of intangible assets | | | - | | | | 0.18 | | | | - | | | | - | | | | - | | Foreign currency adjustments(2) | | | (0.40) | | | | - | | | | - | | | | - | | | | - | | Non-cash interest on convertible debt | | | - | | | | - | | | | - | | | | 0.51 | | | | 0.50 | | Other items, net(4) | | | (0.02) | | | | (0.07) | | | | (0.03) | | | | 0.14 | | | | (0.14) | | Tax adjustments | | | 0.12 | | | | (0.90) | | | | (0.39) | | | | 0.64 | | | | (0.54) | | | | | | | | | | | | | | | | | | | | | | | Non-GAAP net income per share - diluted | | $ | 5.69 | | | $ | 4.76 | | | $ | 4.88 | | | $ | 4.05 | | | $ | 4.00 | | | | | | | | | | | | | | | | | | | | | | |
| (1) | Acquisition and integration related costs consists of items related to either completed or announced acquisitions, including changes in contingent consideration, amortization associated with certain acquired intangible assets, and legal and consulting costs. |
| (2) | Foreign currency adjustments includeconsists of currency remeasurement adjustments related to acquisition related liabilities. |
| (3) | Other items, net, within operating income GAAP toNon-GAAP adjustments includes arbitration costs and acquisition related severance. |
| (4) | Other items, net, within net income GAAP toNon-GAAP adjustments includes arbitration costs, equity investment loss, acquisition related severance and amortization of debt issuance costs. |
APPENDIX B AMENDED2019 EQUITY AND RESTATED 2010 INCENTIVE COMPENSATION PLAN
1.PurposePurpose.. The purpose of this AMENDED AND RESTATED 2010 INCENTIVE COMPENSATION PLAN (the “Plan”) is to assist SYNAPTICS INCORPORATED, a Delaware corporation (the “attract and retainnon-employee Directors, officers and other employeesof the Company”) and its Related Entities in attracting, motivating, retainingSubsidiaries, and rewarding high-quality executivescertain consultants to the Company and other Employees, officers, Directorsits Subsidiaries, and Consultants by enablingto provide to such persons incentives and rewards for service and/or performance. 2. Definitions.As used in this Plan: (a) “Appreciation Right” means a right granted pursuant to acquire or increase a proprietary interest inSection 5 of this Plan. (b) “Base Price” means the Company in orderprice to strengthenbe used as the mutualitybasis for determining the Spread upon the exercise of interests between such persons andan Appreciation Right. (c) “Board” means the Company’s stockholders, and providing such persons with annual and long term performance incentives to expend their maximum efforts in the creationBoard of stockholder value. The Plan is intended to qualify certain compensation awarded under the Plan for tax deductibility under Section 162(m)Directors of the Code (as hereafter defined) to the extent deemed appropriate by the Committee.Company. 2.Definitions. For purposes of the Plan, the following terms shall be defined as set forth below, in addition to such terms defined in Section 1 hereof.
(a) “2016 Effective Date” means the date the Plan is approved by the Company’s stockholders at the annual meeting of the Company’s stockholders held in October 2016.
(b) “Annual(d) “Cash Incentive Award”Award” means a conditional rightcash award granted pursuant to a Participant under Section 7(c) hereof to receive a cash payment, Stock or other Award, unless otherwise determined by the Committee, after the end8 of a specified fiscal year.
(c) “Award” means any Option, Stock Appreciation Right, Restricted Stock, Deferred Stock Unit, Stock granted as a bonus or in lieu of another award, Dividend Equivalent, Other Stock-Based Award, Performance Award or Annual Incentive Award, together with any other right or interest, granted to a Participant under thethis Plan.
(d) “Beneficiary” means the person, persons, trust or trusts which have been designated by a Participant in his or her most recent written beneficiary designation filed with the Committee to receive the benefits specified under the Plan upon such Participant’s death or to which Awards or other rights are transferred if and to the extent permitted under Section 10(b) hereof. If, upon a Participant’s death, there is no designated Beneficiary or surviving designated Beneficiary, then the term Beneficiary means the person, persons, trust or trusts entitled by will or the laws of descent and distribution to receive such benefits.
(e) “Beneficial Owner”, “Beneficially Owning” and “Beneficial Ownership” shall have the meanings ascribed to such terms in Rule 13d-3 under the Exchange Act and any successor to such Rule. (f) “Board” means the Company’s Board of Directors.
(g) “Cause”“Cause” shall, with respect to any Participant, have the equivalent meaning (or the same meaning as “cause” or “for cause”) set forth in any employment, consulting, change in control or other agreement for the performance of services between the Participant and the Company or a Related EntitySubsidiary or, in the absence of any such agreement or any such definition in such agreement, such term shall mean (i) the failure by the Participant to perform his or her duties as assigned by the Company (or a Related Entity) in a reasonable manner, (ii)Participant’s willful, material, and irreparable breach of any violation or breach by the Participant of his or her employment, consulting, or other similarchange in control agreement withbetween the Participant and the Company (oror a Related Entity), ifSubsidiary, (ii) the Participant’s gross negligence in the performance or intentional nonperformance (continuing for thirty (30) days after receipt of written notice of need to cure) of any (iii) any violation or breach byof the Participant of his or her non-competition and/or non-disclosure agreement withParticipant’s material duties and responsibilities to the Company, (or a Related Entity), if any, (iv) any act by(iii) the Participant ofParticipant’s willful dishonesty, fraud, or bad faithmisconduct with respect to the business or affairs of the Company, (or a Related Entity), (v) chronic addiction to alcohol, drugswhich materially and adversely affects the operations or other similar substances affectingreputation of the Company, (iv) the Participant’s work performance,indictment for, conviction of, or (vi) the commission by the Participant of any act, misdemeanor,guilty plea to a felony crime involving dishonesty or crime reflecting unfavorably upon the Participantmoral turpitude whether or not relating to the Company, or any Related Entity.(v) a confirmed positive illegal drug test. The good faith determination by the Committee of whether the Participant’s Continuous Serviceemployment or service was terminated by the Company (or a Subsidiary) for “Cause” shall be final and binding for all purposes hereunder.
(h) “Change(f) “Change in Control” means a Change in Control as defined with related termsControl” has the meaning set forth in Section 912 of thethis Plan.
(i) “Code”(g) “Code” means the Internal Revenue Code of 1986, as amended from time to time, including regulations thereunder and successor provisions and regulations thereto.
time.(j) “Committee”(h) “Committee” means athe Compensation Committee of the Board (or its successor(s)), or any other committee of the Board designated by the Board to administer this Plan pursuant to Section 10 of this Plan, and to the Plan; provided, however, thatextent of any delegation by the Committee shall consistto a subcommittee pursuant to Section 10 of at least two directors, and each member of which shall be this Plan, such subcommittee.
(i) a “non-employee director” within the meaning of Rule 16b-3 under the Exchange Act, unless administration of the Plan by “non-employee directors” is not then required in order for exemptions under Rule 16b-3 to apply to transactions under the Plan, and (ii) an “outside director” within the meaning of Section 162(m) of the Code, unless administration of the Plan by “outside directors” is not then required in order to qualify for tax deductibility under Section 162(m) of the Code. (k) “Common Stock”“Common Stock” means the common stock, of the Company, par value $0.001 per share.
(l) “Company” has the meaning set forth in Section 1.
(m) “Consultant” means any person (other than an Employee or a Director, solely with respect to rendering services in such person’s capacity as a director) who is engaged byshare, of the Company or any Related Entitysecurity into which such common stock may be changed by reason of any transaction or event of the type referred to render consultingin Section 11 of this Plan.
(j) “Company” means Synaptics Incorporated, a Delaware corporation, and its successors. (k) “Date of Grant” means the date provided for by the Committee on which a grant of Option Rights, Appreciation Rights, Performance Shares, Performance Units, Cash Incentive Awards, or advisory servicesother awards contemplated by Section 9 of this Plan, or a grant or sale of Restricted Stock, Restricted Stock Units, or other awards contemplated by Section 9 of this Plan, will become effective (which date will not be earlier than the date on which the Committee takes action with respect thereto). (l) “Director” means a member of the Board. (m) “Disability” means, unless otherwise defined in the applicable Evidence of Award, (i) the Participant is unable to engage in any substantial gainful activity by reason of any medically determinable physical or mental impairment that can be expected to result in death or can be expected to last for a continuous period of not less than 12 months, or (ii) the Participant is, by reason of any medically determinable physical or mental impairment that can be expected to result in death or can be expected to last for a continuous period of not less than 12 months, receiving income replacement benefits for a period of not less than three months under an accident and health plan covering employees of the Company or, such Related Entity.if applicable, any Subsidiary. (n) “Continuous Service”“Effective Date” means uninterrupted provisionthe date this Plan is approved by the Stockholders. (o) “Evidence of servicesAward” means an agreement, certificate, resolution or other type or form of writing or other evidence approved by the Committee that sets forth the terms and conditions of the awards granted under this Plan. An Evidence of Award may be in an electronic medium, may be limited to notation on the books and records of the Company in any capacity of Employee, Director, or Consultant. Continuous Service shalland, unless otherwise determined by the Committee, need not be considered to be interrupted in the case of (i) any approved leave of absence, (ii) transfers among the Company, any Related Entities, or any successor entities, in any capacity of Employee Director, or Consultant, or (iii) any change in status as long as the individual remains in the servicesigned by a representative of the Company or a Related Entity in any capacity of Employee, Director, or Consultant (except as otherwise provided in the Option Agreement). An approved leave of absence shall include sick leave, military leave, or any other authorized personal leave. A leave of absence will be treated as Continuous Service for purposes of determining the continued vesting of an Award (as differentiated from the use of Continuous Service as a trigger for the termination or forfeiture of the Award) only to the extent provided in the Company’s leave of absence policy, in the written terms of any leave of absence agreement applicable to the Participant, or as otherwise required by law. (o) “Controlling Interest” has the meaning set forth in Section 9(b)(iii).Participant.
(p) “Covered Employee” means an Eligible Person who is a Covered Employee as specified in Section 7(e) of the Plan. (q) “Deferred Stock Unit” means a right, granted to a Participant under Section 6(e) hereof, to receive Stock, cash or a combination thereof at the end of a specified deferral period.
(r) “Director” means a member of the Board or the board of directors of any Related Entity.
(s) “Director Compensation Limit” has the meaning set forth in Section 5(c).
(t) “Disability” means a permanent and total disability (within the meaning of Section 22(e) of the Code), as determined by a medical doctor satisfactory to the Committee.
(u) “Dividend Equivalent” means a right, granted to a Participant, to receive cash, Stock, other Awards or other property equal in value to dividends paid with respect to a specified number of shares of Stock, or other periodic payments.
(v) “Effective Date” means October 19, 2010, which was the date of the 2010 Annual Meeting of Stockholders of the Company at which this Plan was approved by the Company’s stockholders.
(w) “Eligible Person” means each Executive Officer of the Company (as defined under the Exchange Act) and other officers, Directors and Employees of the Company or of any Related Entity, and Consultants with the Company or any Related Entity. The foregoing notwithstanding, only employees of the Company, the Parent, or any Subsidiary shall be Eligible Persons for purposes of receiving any Incentive Stock Options. An Employee on leave of absence may be considered as still in the employ of the Company or a Related Entity for purposes of eligibility for participation in the Plan.
(x) “Employee” means any person, including an officer or Director, who is an employee of the Company or any Related Entity. The Payment of a director’s fee by the Company or a Related Entity shall not be sufficient to constitute “employment” by the Company.
(y) “Exchange Act”“Exchange Act” means the Securities Exchange Act of 1934, as amended, and the rules and regulations thereunder, as such law, rules and regulations may be amended from time to time, including rules thereunder and successor provisions and rules thereto.time.
(z) “Executive Officer”(q) “Executive Officer” means an executive officer of the Company as defined under the Exchange Act.
(aa) “Exercise Price” has the meaning set forth in Section 6(b)(iii).
(bb) “Fair Market Value”(r) “Incentive Stock Option” means the fair market value of Stock, Awards or other property as determined by the Committee. Unless otherwise determined by the Committee, the Fair Market Value of Stock as of any given date shall be the closing sale price per share reported on a consolidated basis for stock listed on the principal stock exchange or market on which Stockan Option Right that is traded on the date as of which such value is being determined or, if there is no sale on that date, then on the last previous day on which a sale was reported.
(cc) “Full Value Award” shall mean a Stock Award that does not require, for issuance of the underlying share, the payment by the Participant of an exercise or strike price (beyond payment of par value, as applicable), i.e., a Stock Award the value of which is measured by something other than the appreciation of the share of Stock above the Fair Market Value per share of Stock determined on the date of grant of the Award.
(dd) “Good Reason” shall, with respect to any Participant, have the equivalent meaning (or the same meaning as “good reason” or “for good reason”) set forth in any employment, consulting, change in control or other agreement for the performance of services between the Participant and the Company or a Related Entity. In the absence of any such agreement, such term shall mean (i) the assignment to the Participant of any duties inconsistent in any respect with the Participant’s position (including status, offices, titles and reporting requirements), authority, duties or responsibilities as assigned by the Company (or a Related Entity), or any other action by the Company (or a Related Entity) which results in a diminution in such position, authority, duties or responsibilities, excluding for this purpose an isolated, insubstantial and inadvertent action not taken in bad faith and which is remedied by the Company (or a Related Entity) promptly after receipt of notice thereof given by the Participant; (ii) any failure by the Company (or a Related Entity) to comply with its obligations to the Participant as agreed upon, other than an isolated, insubstantial and inadvertent failure not occurring in bad faith and which is remedied by the Company (or a Related Entity) promptly after receipt of notice thereof given by the Participant; (iii) the Company’s (or Related Entity’s) requiring the Participant to be based at any office or location outside of fifty miles from the location of employment as of the date of Award, except for travel reasonably required in the performance of the Participant’s responsibilities; (iv) any purported termination by the Company (or a Related Entity) of the Participant’s Continuous Service otherwise than for Cause as defined in Section 2(g), or by reason of the Participant’s Disability as defined in Section 2(v); provided, however, that to resign for Good Reason, a Participant must provide written notice of the conditions giving rise to Good Reason within 90 days following the date on which the condition arises, allow the Company at least 30 days to cure such condition, and, if not so cured, resign from all positions then held with the Company within 90 days after the expiration of the cure period. For purposes of this Section 2(gg), any good faith determination of “Good Reason” made by the Committee shall be conclusive.
(ee) “Immediate Family” has the meaning set forth in Section 10(b)(ii).
(ff) “Incentive Stock Option” means any Option intended to be designatedqualify as an incentive“incentive stock option within the meaning ofoption” under Section 422 of the Code or any successor provision thereto.provision.
(gg) “Incumbent Board” has(s) “Management Objectives” means the meaningmeasurable performance objective or objectives established pursuant to this Plan for Participants who have received grants of Performance Shares, Performance Units or Cash Incentive Awards or, when so determined by the Committee, Option Rights, Appreciation Rights, Restricted Stock, Restricted Stock Units, dividend equivalents or other awards pursuant to this Plan. If the Committee determines that a change in the business, operations, corporate structure or capital structure of the Company, or the manner in which it conducts its business, or other events or circumstances render the Management Objectives unsuitable, the Committee may in its discretion modify such Management Objectives or the acceptable levels of achievement, in whole or in part, as the Committee deems appropriate and equitable.
(t) “Market Value per Share” means, as of any particular date, the closing price of a share of Common Stock as reported for that date on the Nasdaq Stock Market or, if the shares of Common Stock are not then listed on the Nasdaq Stock Market, on any other national securities exchange on which the shares of Common Stock are listed, or if there are no sales on such date, on the next preceding trading day during which a sale occurred. If there is no regular public trading market for the shares of Common Stock, then the Market Value per Share shall be the fair market value as determined in good faith by the Committee. The Committee is authorized to adopt another fair market value pricing method provided such method is stated in the applicable Evidence of Award and is in compliance with the fair market value pricing rules set forth in Section 9(b)(ii).409A of the Code. (hh) “Independent Director”(u) “Optionee” means the optionee named in an Evidence of Award evidencing an outstanding Option Right.
(v) “Option Price” means the purchase price payable on exercise of an Option Right. (w) “Option Right” means the right to purchase shares of Common Stock upon exercise of an award granted pursuant to Section 4 of this Plan. (x) “Participant” means a member of the Boardperson who is notselected by the Committee to receive benefits under this Plan and who is at the time (i) anon-employee Director, (ii) an officer or other employee of the Company or its Subsidiaries. (ii) “Option” means a right granted to a Participant under Section 6(b) hereof, to purchase Stock or other Awards at a specified price during specified time periods.
(jj) “Optionee” means a person to whom an Option is granted under this Plan or any person who succeeds to the rights of such person under this Plan.
(kk) “Other Stock-Based Awards” means Awards granted to a Participant under Section 6(h) hereof.
(ll) “Parent” means a “parent corporation,” whether now or hereafter existing, as defined in Section 424(e) of the Code.
(mm) “Participant” meansSubsidiary, including a person who has been granted an Award underagreed to commence serving in such capacity within 90 days of the Plan which remains outstanding,Date of Grant, or (iii) a person, including a consultant, who provides services to the Company or any Subsidiary that are equivalent to those typically provided by an employee (provided that such person who is no longersatisfies the FormS-8 definition of an Eligible Person.“employee”).
(nn) “(y) “Performance Period” means, in respect of a Cash Incentive Award, Performance Share or Performance Unit, a period of time established pursuant to Section 8 of this Plan within which the Management Objectives relating to such Cash Incentive Award,” Performance Share or Performance Unit are to be achieved.
(z) “Performance Share” means a right, grantedbookkeeping entry that records the equivalent of one share of Common Stock awarded pursuant to an Eligible Person under Section 7 hereof,8 of this Plan. (aa) “Performance Unit” means a bookkeeping entry awarded pursuant to receive Awards based upon performance criteria specifiedSection 8 of this Plan that records a unit equivalent to $1.00 or such other value as is determined by the Committee. (oo) “Person” shall have(bb) “Plan” means this Synaptics Incorporated 2019 Equity and Incentive Compensation Plan, as amended or amended and restated from time to time.
(cc) “Predecessor Plans” means the meaning ascribed to such term in Section 3(a)(9)Synaptics Incorporated Amended and Restated 2010 Incentive Compensation Plan and the Synaptics Incorporated Amended and Restated 2001 Incentive Compensation Plan, as amended. (dd) “Replacement Award” means an award (i) of the Exchange Act and used in Sections 13(d) and 14(d) thereof, and shall includesame type (e.g., time-based restricted stock units) as the replaced award, (ii) that has a “group” as defined in Section 13(d) thereof. (pp) “Plan” hasvalue at least equal to the meaning set forth in Section 1.
(qq) “Related Entity” means any Parent, Subsidiary, and any business, corporation, partnership, limited liability company, or other entity designated byvalue of the Committee in whichreplaced award, (iii) that relates to publicly traded equity securities of the Company a Parent, or a Subsidiary, directlyits successor in the Change in Control or indirectly, holds a substantial ownership interest.
(rr) “Restricted Stock” means Stock granted to aanother entity that is affiliated with the Company or its successor following the Change in Control, (iv) if the Participant under Section 6(d) hereof, thatholding the replaced award is subject to certain restrictions andU.S. federal income tax under the Code, the tax consequences of which to a risk of forfeiture.
(ss) “Rule 16b-3” and “Rule 16a-1(c)(3)” means Rule 16b-3 and Rule 16a-1(c)(3), as from timesuch Participant under the Code are not less favorable to time in effect and applicable tosuch Participant than the Plan and Participants, promulgated by the Securities and Exchange Commission under Section 16tax consequences of the Exchange Act.
(tt) “Share Reserve” hasreplaced award, and (v) the meaning set forth in Section 4(a).
(uu) “Stock” means the Company’s Common Stock, and such other securities as may be substituted (or resubstituted) for Stock pursuant to Section 10(c) hereof.
(vv) “Stock Appreciation Right” means a right granted to a Participant under Section 6(c) hereof.
(ww) “Subsidiary” means a “subsidiary corporation” whether now or hereafter existing, as defined in Section 424(f) of the Code.
3.Administration.
(a)Authority of the Committee. The Plan shall be administered by the Committee. The Committee shall have full and final authority, in each case subject to and consistent with the provisions of the Plan, to select Eligible Persons to become Participants, grant Awards, determine the type, number and other terms and conditions of which are not less favorable to the Participant holding the replaced award than the terms and all other matters relating to, Awards, prescribe Award agreements (which need not be identical for each Participant) and rules and regulations for the administrationconditions of the Plan, construe and interpretreplaced award (including the Plan andprovisions that would apply in the event of a subsequent Change in Control). A Replacement Award agreements and correct defects, supply omissionsmay be granted only to the extent it does not result in the replaced award or reconcile inconsistencies therein, andReplacement Award failing to make all other decisions and determinations as the Committee may deem necessarycomply with or advisable for the administrationbe exempt from Section 409A of the Plan. In exercising any discretion granted toCode. Without limiting the Committee under the Plan or pursuant to any Award, the Committee shall not be required to follow past practices, act in a manner consistent with past practices, or treat any Eligible Person in a manner consistent with the treatment of other Eligible Persons.
(b)Manner of Exercise of Committee Authority. Any actiongenerality of the Committee shallforegoing, the Replacement Award may take the form of a continuation of the replaced award if the requirements of the two preceding sentences are satisfied. The determination of whether these conditions are satisfied will be final, conclusive and binding on all persons, including the Company, its Related Entities, Participants, Beneficiaries, transferees under Section 10(b) hereof or other persons claiming rights from or through a Participant, and stockholders. The express grant of any specific power to the Committee, and the taking of any actionmade by the Committee, shall not be construed as limiting any powerconstituted immediately before the Change in Control, in its sole discretion.
(ee) “Restricted Stock” means shares of Common Stock granted or authoritysold pursuant to Section 6 of this Plan as to which neither the substantial risk of forfeiture nor the prohibition on transfers has expired. (ff) “Restricted Stock Units” means an award made pursuant to Section 7 of this Plan of the Committee. The Committeeright to receive shares of Common Stock, cash or a combination thereof at the end of the applicable Restriction Period. (gg) “Restriction Period” means the period of time during which Restricted Stock Units are subject to restrictions, as provided in Section 7 of this Plan. (hh) “Spread” means the excess of the Market Value per Share on the date when an Appreciation Right is exercised over the Base Price provided for with respect to the Appreciation Right. (ii) “Stockholder” means an individual or entity that owns one or more shares of Common Stock. (jj) “Subsidiary” means a corporation, company or other entity (i) more than 50% of whose outstanding shares or securities (representing the right to vote for the election of directors or other managing authority) are, or (ii) which does not have outstanding shares or securities (as may delegatebe the case in a partnership, joint venture, limited liability company, unincorporated association or other similar entity), but more than 50% of whose ownership interest representing the right generally to officersmake decisions for such other entity is, now or managershereafter, owned or controlled, directly or indirectly, by the Company;provided,however, that for purposes of determining whether any person may be a Participant for purposes of any grant of Incentive Stock Options, “Subsidiary” means any corporation in which the Company at the time owns or controls, directly or indirectly, more than 50% of the total combined Voting Power represented by all classes of stock issued by such corporation. (kk) “Voting Power” means, at any time, the combined voting power of the then-outstanding securities entitled to vote generally in the election of Directors in the case of the Company or any Related Entity, or committees thereof, the authority, subject to such terms as the Committee shall determine, (i) to perform administrative functions, (ii) with respect to Participants not subject to Section 16members of the Exchange Act, to perform such other functions as the Committee may determine, and (iii) with respect to Participants subject to Section 16, to perform such other functionsboard of the Committee as the Committee may determine to the extent performance of such functions will not resultdirectors or similar body in the losscase of an exemption under Rule 16b-3 otherwise available for transactions by such persons, in each case to the extent permitted under applicable law and subject to the requirements set forth in Section 7(d). The Committee may appoint agents to assist it in administering theanother entity. 3. Shares Available Under this Plan. (c)Limitation of Liability. The Committee, and each member thereof, shall be entitled to, in good faith, rely or act upon any report or other information furnished to him or her by any Executive Officer, other officer or Employee, the Company’s independent auditors, Consultants or any other agents assisting in the administration of the Plan.
Members of the Committee, and any officer or Employee acting at the direction or on behalf of the Committee, shall not be personally liable for any action or determination taken or made in good faith with respect to the(a) Maximum Shares Available Under this Plan and shall, to the extent permitted by law, be fully indemnified and protected by the Company with respect to any such action or determination.
4.Stock Subject to Plan.
(a)Limitation
| (i) | Subject to adjustment as provided in Section 11 of this Plan and the share counting rules set forth in Section 3(b) of this Plan, the number of shares of Common Stock available under this Plan for awards of (A) Option Rights or Appreciation Rights, (B) Restricted Stock, (C) Restricted Stock Units, (D) Performance Shares or Performance Units, (E) awards contemplated by Section 9 of this Plan, or (F) dividend equivalents paid with respect to awards made under this Plan will not exceed in the aggregate 1,660,000 shares of Common Stock. Such shares may be shares of original issuance or treasury shares or a combination of the foregoing. |
| (ii) | The aggregate number of shares of Common Stock available under Section 3(a)(i) of this Plan will be reduced by one share of Common Stock for every one share of Common Stock subject to each award granted under this Plan. |
(b) Share Counting Rules. | (i) | Except as provided in Section 22 of this Plan, if any award granted under this Plan is cancelled or forfeited, expires, is settled for cash (in whole or in part), or is unearned (in whole or in part), the shares of Common Stock subject to such award will, to the extent of such cancellation, forfeiture, expiration, cash settlement, or unearned amount, again be available under Section 3(a)(i) above. |
| (ii) | If, after the Effective Date, any shares of Common Stock subject to an award granted under the Predecessor Plans are forfeited, or an award granted under the Predecessor Plans is cancelled or forfeited, expires, is settled for cash (in whole or in part), or is unearned (in whole or in part), the shares of Common Stock subject to such award will, to the extent of such cancellation, forfeiture, expiration, cash settlement, or unearned amount, be available for awards under this Plan. |
| (iii) | Notwithstanding anything to the contrary contained in this Plan: (A) shares of Common Stock withheld by the Company, tendered or otherwise used in payment of the Option Price of an Option Right will not be added (or added back, as applicable) to the aggregate number of shares of Common Stock available under Section 3(a)(i) of this Plan; (B) shares of Common Stock withheld by the Company, tendered or otherwise used to satisfy tax withholding with respect to awards will not be added (or added back, as applicable) to the aggregate number of shares of Common Stock available under Section 3(a)(i) of this Plan; (C) shares of Common Stock subject to an Appreciation Right that are not actually issued in connection with the settlement of such Appreciation Right on the exercise thereof will not be added back to the aggregate number of shares of Common Stock available under Section 3(a)(i) of this Plan; and (D) shares of Common Stock reacquired by the Company on the open market or otherwise using cash proceeds from the exercise of Option Rights will not be added (or added back, as applicable) to the aggregate number of shares of Common Stock available under Section 3(a)(i) of this Plan. |
| (iv) | If, under this Plan, a Participant has elected to give up the right to receive compensation in exchange for shares of Common Stock based on fair market value, such shares of Common Stock will not count against the aggregate limit under Section 3(a)(i) of this Plan. |
(c) Limit on Overall Number of Shares Subject to Awards. Subject to adjustment as provided in Section 10(c) hereof, the total number of shares ofIncentive Stock reserved and available for delivery in connection with Awards under the Plan shall equal 13,099,415 shares of Stock (the “Share Reserve”). Any shares of Stock delivered under the Plan may consist, in whole or in part, of authorized and unissued shares or treasury shares. Full Value Awards granted under the Plan on or after the 2016 Effective Date shall count as 1.94 shares of Stock for purposes of the share limits under the Plan. If any shares of Stock covered by an Award granted under the Plan, or to which such an Award relates, are forfeited, or if an Award has expired, terminated or been canceled for any reason whatsoever (other than by reason of exercise or vesting), then the shares of Stock covered by such Award shall again be, or shall become, shares of Stock with respect to which Awards may be granted hereunder (and for the avoidance of doubt, after the 2016 Effective Date, any shares of Stock covered by Full Value Awards shall be returned to the Plan as 1.94 Shares for purposes of the share limits under the Plan). (b)Availability of Shares Not Issued pursuant to Full Value Awards. In the event that any withholding tax liabilities arising from a Full Value Award are satisfied by the withholding of shares of Stock from the Full Value Award by the Company, then only the number of shares of Stock issued net of the shares of Stock withheld shall be counted as issued for purposes of determining the maximum number of shares of Stock available for grant under the Plan.Options. Notwithstanding anything to the contrary contained in this Plan: (i) shares of Stock withheld by the Company, tenderedSection 3 or otherwise usedelsewhere in payment of the exercise price of an Option will not be added (or added back, as applicable) to the maximum number of shares of Stock available under the Plan; (ii) shares of Stock withheld by the Company, tendered or otherwise used to satisfy a tax withholding obligation with respect to Optionsthis Plan, and Stock Appreciation Rights will not be added (or added back, as applicable) to the maximum number of shares of Stock available under the Plan; (iii) shares of Stock subject to a Stock Appreciation Right that are not actually issuedadjustment as provided in connection with the settlement in sharesSection 11 of Stock of such Stock Appreciation Right on the exercise thereof, will not be added back to the maximum number of shares of Stock available under the Plan; and (iv) shares of Stock reacquired by the Company on the open market or otherwise using cash proceeds from the exercise of an Option will not be added tothis Plan, the aggregate number of shares of Common Stock available underactually issued or transferred by the Plan.
(c)Limitation on NumberCompany upon the exercise of Incentive Stock Option Shares. Subject to adjustment as provided in Section 10(c) hereof, the number ofOptions will not exceed 1,660,000 shares of Stock which may be issued pursuant to Incentive Stock Options shall be the lesser of (i) the number of shares of Stock that may be subject to Awards under Section 4(a), or (ii) 15,000,000.Common Stock.
(d)Minimum Vesting Requirements.Requirements. In general, no Awardaward granted on or after the 2016 Effective Date may vest, in the ordinary course, prior to the first anniversary of the date of grant of the Award.earlier than after aone-year vesting period or aone-year performance period, as applicable. However, up to 5% of the sum of (i) the number of shares available for issuance under the Share Reserveaggregate limit under Section 3(a)(i) of this Plan as of the 2016 Effective Date plus (ii) the number of shares that are returned to the Share Reserveaggregate number of shares of Common Stock available under Section 3(a)(i) of this Plan from time to time pursuant to Awardsawards that are cancelled or forfeited, expire, are settled for cash (in whole or have expired, terminatedin part), or been canceled for any reason whatsoever (other than by reason of exerciseare unearned (in whole or vesting)in part), including shares of Common Stock that are returned to the Share Reserveaggregate number of shares of Common stock available under Section 3(a)(i) from Awardsawards outstanding on the 2016 Effective Date, or from Full Value Awards in satisfaction of withholding tax liabilities, may be granted on or after the 2016 Effective Date in the form of Awardsawards that do not meet such vesting requirements. Nothing in this Section 4(d)3(d) shall limit the Company’s ability to grant Awardsawards that contain rights to accelerated vesting on a termination of employment or service, or limit the Company’s powers under Section 10(c).11 or Section 18(c) of this Plan. In addition, the minimum vesting criteria set forth in this Section 4(d)3(d) shall not apply to Awardsawards granted pursuant to an assumption of or substitution for another stock award (which stock award was granted by another Person)person) in connection with a Change in Control or acquisition by the Company of the other Person.person. (e)Application of LimitationsNon-Employee Director Compensation Limit. The limitationsNotwithstanding anything contained in this Section 4 shall apply only3, or elsewhere in this Plan, to Awards that are settled by the delivery of shares of Stock. The Committee may adopt reasonable counting procedures to ensure appropriate counting, avoid double counting (as, for example, in the case of tandem or substitute awards)contrary and make adjustments if the number of shares of Stock actually delivered differs from the number of shares previously counted in connection with an Award. 5.Eligibility; Per-Person Award Limitations.
(a)Eligibility. Awards may be granted under the Plan only to Eligible Persons.
(b)Per-Person Limitations. In each fiscal year during any part of which the Plan is in effect, (i) an Eligible Person may not be granted Awards relating to more than 1,000,000 shares of Stock, subject to adjustment as provided in Section 10(c), under each11 of Sections 6(b), 6(c), 6(d), 6(e), 6(f), 6(g), 6(h), 7(b) and 7(c); (ii) the maximum amount that may be
earned as an Annual Incentive Award or other cash Award (but excluding Performance Awards)this Plan, in no event will anynon-employee Director in any fiscalcalendar year by any one Participant shall be $2,000,000, and (iii) the maximum amount that may be earned as a Performance Award in respect of a performance period by any one Participant shall be $5,000,000. If a Performance Award could (but is not required to) be paid out in cash, it will count only against the share limit under clause (i) above.
(c)Limitation on Awards for Independent Directors. In addition to any other limitations set forth this Section 5, in any fiscal year, no Independent Director will be granted compensatory equitycompensation (including, without limitation, cash compensation) for such service having an aggregate maximum value (measured at the Date of Grant as applicable, and calculating the value of any awards (under this Plan or any other stock plan ofbased on the Company) that have an aggregate grant date fair value (as determined by the Company for financial reporting purposes) that, during such fiscal year, exceed $750,000 for such fiscal year (the “Director Compensation Limit”). If the Company determines that the value of such equity awards with respect to an Independent Director exceed the Director Compensation Limit, the affected Independent Director shall return the excess compensation to the Company within 30 days after receiving written notice of such overpayment, with such reimbursement made from the number of shares of Stock granted to the Independent Director that had a grant date fair value in excess of the Director Compensation Limit.$750,000. For the avoidance of doubt, in a year in which an Independentanon-employee Director serves as an employee or consultant (including as an interim officer), the Director Compensation Limitsuch limit shall not apply to compensatory equity awards grantedcompensation approved to be paid to suchnon-employee Director by the other Independent Directors to him or hernon-employee directors in respect of such service as an employee or consultant.consultant
6.
4. Specific Terms of AwardsOption Rights.. (a)General. AwardsThe Committee may, be granted on thefrom time to time and upon such terms and conditions set forth in this Section 6. In addition,as it may determine, authorize the Committeegranting to Participants of Option Rights. Each such grant may impose onutilize any Award or the exercise thereof, at the date of grant or thereafter (subject to Section 10(f)), such additional terms and conditions, not inconsistent with the provisionsall of the Plan, as the Committee shall determine, including terms requiring forfeiture of Awards in the event of termination of Continuous Service by the Participantauthorizations, and terms permitting a Participant to make elections relating to his or her Award. The Committee shall retain full power and discretion to accelerate, waive or modify, at any time, any term or condition of an Award that is not mandatory under the Plan. Except in cases in which the Committee is authorized to require other forms of consideration under the Plan, or to the extent other forms of consideration must be paid to satisfy the requirements of Delaware law, no consideration other than services may be required for the grant (but not the exercise) of any Award.
(b)Options. The Committee is authorized to grant Options to Participants on the following terms and conditions:
(i)Stock Option Agreement. Each grant of an Option under the Plan shall be evidenced by a Stock Option Agreement. Such Stock Option Agreement shallwill be subject to all applicable terms and conditions of the Plan and may be subject to any other terms and conditions which are not inconsistent withrequirements, contained in the Plan and which the Committee deems appropriate for inclusion in a Stock Option Agreement. The provisions of the various Stock Option Agreements entered into under the Plan need not be identical.following provisions:
(ii)Number of Shares.(a) Each Stock Option Agreement shallgrant will specify the number of shares of Common Stock that areto which it pertains subject to the limitations set forth in Section 3 of this Plan.
(b) Each grant will specify an Option and shall provide for the adjustment of such number in accordance with Section 10(c) hereof. The Stock Option Agreement shall also specify whether the Option is an Incentive Stock Option or a Non-Qualified Stock Option, and in the absence of such designation, the Option shall be a Non-Qualified Stock Option. (iii)Exercise Price.
(A)In General. Each Stock Option Agreement shall state the price at which shares of Stock subject to the Option may be purchased (the “Exercise Price”), which shall be not less than 100% of the Fair Market Value of the Stock on the date of grant.
(B)Ten Percent Stockholder. If an individual owns or is deemed to own (by reason of the attribution rules applicable under Section 424(d) of the Code) more than 10% of the combined voting power of all classes of stock of the Company or any Related Entity, the Exercise Price of an Incentive Stock Option must be at least 110% of the Fair Market Value of aper share of Common Stock, on the date of grant and such Incentive Stockwhich Option by its terms is not exercisable after the expiration of five years from the date of grant.
(iv)Time and Method of Exercise. The Committee shall determine the time or times at which or the circumstances under which an Option may be exercised in whole or in part (including based on achievement of performance goals and/or future service requirements). The Committee may also determine the time or times at which Options shall cease to be or become exercisable following termination of Continuous Service or upon other conditions. The Committee may determine the methods by which such exercise price may be paid or deemed to be paid (including in the discretion of the
Committee a cashless exercise procedure), the form of such payment, including, without limitation, cash, Stock, other Awards or awards granted under other plans of the Company or a Related Entity, or other property (including notes or other contractual obligations of Participants to make payment on a deferred basis), and the methods by or forms in which Stock will be delivered or deemed to be delivered to Participants.
(v)Incentive Stock Options. The terms of any Incentive Stock Option granted under the Plan shall comply in all respects with the provisions of Section 422 of the Code. Anything in the Plan to the contrary notwithstanding, no term of the Plan relating to Incentive Stock Options (including any Stock Appreciation Rights in tandem therewith) shall be interpreted, amended or altered, nor shall any discretion or authority granted under the Plan be exercised, so as to disqualify either the Plan or any Incentive Stock Option under Section 422 of the Code, unless the Participant has first requested the change that will result in such disqualification or except as permitted under Section 9 and Section 10(c). Thus, if and to the extent required to comply with Section 422 of the Code, Options granted as Incentive Stock Options shall be subject to the following special terms and conditions:
(A) the Option shall not be exercisable more than seven years after the date such Incentive Stock Option is granted; provided, however, that if a Participant owns or is deemed to own (by reason of the attribution rules of Section 424(d) of the Code) more than 10% of the combined voting power of all classes of stock of the Company or any Parent Corporation and the Incentive Stock Option is granted to such Participant, the term of the Incentive Stock Option shall be (to the extent required by the Code at the time of the grant) for no more than five years from the date of grant; and
(B) The aggregate Fair Market Value (determined as of the date the Incentive Stock Option is granted) of the shares of stockPrice (except with respect to which Incentive Stock Options grantedawards under the Plan and all other option plansSection 22 of the Company or its Parent Corporation during any calendar year are exercisable for the first time by the Participant during any calendar year shall not (to the extent required by the Code at the time of the grant) exceed $100,000.
(vi)Repurchase Rights. The Committee shall have the discretion to grant Options which are exercisable for unvested shares of Common Stock. Should the Optionee’s Continuous Service cease while holding such unvested shares, the Company shall have the right to repurchase, at the exercise price paid per share, any or all of those unvested shares. The terms upon which such repurchase right shall be exercisable (including the period and procedure for exercise and the appropriate vesting schedule for the purchased shares) shall be established by the Committee and set forth in the document evidencing such repurchase right.
(c)Stock Appreciation Rights. The Committee is authorized to grant Stock Appreciation Rights to Participants on the following terms and conditions:
(i)Right to Payment. A Stock Appreciation Right shall confer on the Participant to whom it is granted a right to receive, upon exercise thereof, the excess of (A) the Fair Market Value of one share of stock on the date of exercise, over (B) the grant price of the Stock Appreciation Right as determined by the Committee. The grant price of a Stock Appreciation Right shallthis Plan) may not be less than the Fair Market Value of a share of Stockper Share on the dateDate of grant.Grant.
(c) Each grant will specify whether the Option Price will be payable (i) in cash, by check acceptable to the Company or by wire transfer of immediately available funds, (ii)Other Terms. The Committee shall determine by the actual or constructive transfer to the Company of shares of Common Stock owned by the Optionee having a value at the datetime of grantexercise equal to the total Option Price, (iii) subject to any conditions or thereafter,limitations established by the timeCommittee, by the withholding of shares of Common Stock otherwise issuable upon exercise of an Option Right pursuant to a “net exercise” arrangement (it being understood that, solely for purposes of determining the number of treasury shares held by the Company, the shares of Common Stock so withheld will not be treated as issued and acquired by the Company upon such exercise), (iv) by a combination of such methods of payment, or times at which and the circumstances under which a Stock Appreciation Right(v) by such other methods as may be exercised in wholeapproved by the Committee. (d) To the extent permitted by law, any grant may provide for deferred payment of the Option Price from the proceeds of sale through a bank or in part (including basedbroker on achievementa date satisfactory to the Company of performance goals and/some or future service requirements),all of the time or times atshares of Common Stock to which Stock Appreciation Rights shall ceasesuch exercise relates. (e) Successive grants may be made to be or become exercisable following termination of Continuous Service or upon other conditions, the method of exercise, method of settlement, form of consideration payable in settlement, method by or forms in which Stock will be delivered or deemed to be delivered to Participants,same Participant whether or not any Option Rights previously granted to such Participant remain unexercised. (f) Each grant will specify the period or periods of continuous service by the Optionee with the Company or any Subsidiary, if any, that is necessary before any Option Rights or installments thereof will become exercisable. Option Rights may provide for continued vesting or the earlier exercise of such Option Rights, including in the event of the retirement, death or Disability of a Participant. (g) Any grant of Option Rights may specify Management Objectives that must be achieved as a condition to the exercise of such rights. (h) Option Rights granted under this Plan may be (i) options, including Incentive Stock AppreciationOptions, that are intended to qualify under particular provisions of the Code, (ii) options that are not intended to so qualify, or (iii) combinations of the foregoing. Incentive Stock Options may only be granted to Participants who meet the definition of “employees” under Section 3401(c) of the Code. (i) No Option Right shallwill be exercisable more than 10 years from the Date of Grant. The Committee may provide in tandem or in combination with any otherEvidence of Award and any otherfor the automatic exercise of an Option Right upon such terms and conditions as established by the Committee. (j) Option Rights granted under this Plan may not provide for any dividends or dividend equivalents thereon. (k) Each grant of Option Rights will be evidenced by an Evidence of Award. Each Evidence of Award will be subject to this Plan and will contain such terms and provisions, consistent with this Plan, as the Committee may approve. 5. Appreciation Rights. (a) The Committee may, from time to time and upon such terms and conditions as it may determine, authorize the granting to any StockParticipant of Appreciation Right. StockRights. An Appreciation Right will be the right of the Participant to receive from the Company an amount determined by the Committee, which will be expressed as a percentage of the Spread (not exceeding 100%) at the time of exercise. (b) Each grant of Appreciation Rights may utilize any or all of the authorizations, and will be either freestanding orsubject to all of the requirements, contained in tandem with other Awards.the following provisions: (d)
| (i) | Each grant may specify that the amount payable on exercise of an Appreciation Right will be paid by the Company in cash, shares of Common Stock or any combination thereof. |
| (ii) | Any grant may specify that the amount payable on exercise of an Appreciation Right may not exceed a maximum specified by the Committee on the Date of Grant. |
| (iii) | Any grant may specify waiting periods before exercise and permissible exercise dates or periods. |
| (iv) | Each grant will specify the period or periods of continuous service by the Participant with the Company or any Subsidiary, if any, that is necessary before the Appreciation Rights or installments thereof will become exercisable. Appreciation Rights may provide for continued vesting or the earlier exercise of such Appreciation Rights, including in the event of the retirement, death or Disability of a Participant. |
| (v) | Any grant of Appreciation Rights may specify Management Objectives that must be achieved as a condition of the exercise of such Appreciation Rights. |
| (vi) | Appreciation Rights granted under this Plan may not provide for any dividends or dividend equivalents thereon. |
| (vii) | Successive grants of Appreciation Rights may be made to the same Participant regardless of whether any Appreciation Rights previously granted to the Participant remain unexercised. |
| (viii) | Each grant of Appreciation Rights will be evidenced by an Evidence of Award. Each Evidence of Award will be subject to this Plan and will contain such terms and provisions, consistent with this Plan, as the Committee may approve. |
(c) Also, regarding Appreciation Rights: | (i) | Each grant will specify in respect of each Appreciation Right a Base Price, which (except with respect to awards underSection 22 of this Plan) may not be less than the Market Value per Share on the Date of Grant; and |
| (ii) | No Appreciation Right granted under this Plan may be exercised more than 10 years from the Date of Grant. The Committee may provide in any Evidence of Award for the automatic exercise of an Appreciation Right upon such terms and conditions as established by the Committee. |
6. Restricted StockStock.. The Committee is authorizedmay, from time to time and upon such terms and conditions as it may determine, authorize the grant or sale of Restricted Stock to Participants onParticipants. Each such grant or sale may utilize any or all of the following termsauthorizations, and conditions: (i)Grant and Restrictions. Restricted Stock shallwill be subject to all of the requirements, contained in the following provisions:
(a) Each such restrictions on transferability,grant or sale will constitute an immediate transfer of the ownership of shares of Common Stock to the Participant in consideration of the performance of services, entitling such Participant to voting, dividend and other ownership rights, but subject to the substantial risk of forfeiture and other restrictions if any, as the Committeeon transfer hereinafter described. (b) Each such grant or sale may impose, or as otherwise provided in this Plan. Subject to Section 4(c), the restrictions may lapse separatelybe made without additional consideration or in combination atconsideration of a payment by such times, underParticipant that is less than the Market Value per Share on the Date of Grant. (c) Each such circumstances (including based on achievement of performance goals and/or future service requirements), in such installments or otherwise, as the Committee may determine at the date of grant or thereafter. Except to the extent restricted under the terms of the Plan and any Award agreement relating tosale will provide that the Restricted Stock covered by such grant or sale will be subject to a Participant granted Restricted Stock shall have all“substantial risk of forfeiture” within the meaning of Section 83 of the rights ofCode for a stockholder, including the rightperiod to vote the Restricted Stock and the right to receive dividends thereon (subject to any mandatory reinvestment or other requirement imposed by the Committee). During the restricted period applicable to the Restricted Stock, subject to Section 10(b) below, the Restricted Stock may not be sold, transferred, pledged, hypothecated, margined or otherwise encumbered by the Participant. (ii)Forfeiture. Except as otherwise determined by the Committee aton the timeDate of Grant or until achievement of Management Objectives referred to in Section 6(e) of this Plan.
(d) Each such grant or sale will provide that during or after the period for which such substantial risk of forfeiture is to continue, the transferability of the Award, uponRestricted Stock will be prohibited or restricted in the manner and to the extent prescribed by the Committee on the Date of Grant (which restrictions may include rights of repurchase or first refusal of the Company or provisions subjecting the Restricted Stock to a continuing substantial risk of forfeiture while held by any transferee). (e) Any grant of Restricted Stock may specify Management Objectives that, if achieved, will result in termination or early termination of a Participant’s Continuous Service during the applicable restriction period, the Participant’s Restricted Stock that is at that time subject to restrictions shall be forfeited (or, in accordance with Section 6(b)(vi), reacquired by the Company); provided that the Committee may provide, by rule or regulation or in any Award agreement, or may determine in any individual case, that restrictions or forfeiture conditions relating to Restricted Stock shall be waived in whole or in part in the event of terminations resulting from specified causes, and the Committee may in other cases waive in whole or in part the forfeiture of Restricted Stock. (iii)Certificates for Stock. Restricted Stock granted under the Plan may be evidenced in such manner as the Committee shall determine. If certificates representing Restricted Stock are registered in the name of the Participant, the Committee may require that such certificates bear an appropriate legend referring to the terms, conditions and restrictions applicable to such Restricted Stock.
(f) Notwithstanding anything to the contrary contained in this Plan, Restricted Stock may provide for continued vesting or the earlier termination of restrictions on such Restricted Stock, including in the event of the retirement, death or Disability of a Participant. (g) Any such grant or sale of Restricted Stock will require that any and all dividends or other distributions paid thereon during the period of such restrictions be automatically deferred and/or reinvested in additional Restricted Stock, which will be subject to the same restrictions as the underlying award. For the avoidance of doubt, any such dividends or other distributions on Restricted Stock will be deferred until, and paid contingent upon, the vesting of such Restricted Stock. (h) Each grant or sale of Restricted Stock will be evidenced by an Evidence of Award. Each Evidence of Award will be subject to this Plan and will contain such terms and provisions, consistent with this Plan, as the Committee may approve. Unless otherwise directed by the Committee, (i) all certificates representing Restricted Stock will be held in custody by the Company retain physical possession of the certificates, and that the Participant deliveruntil all restrictions thereon will have lapsed, together with a stock power toor powers executed by the Company,Participant in whose name such certificates are registered, endorsed in blank and covering such shares or (ii) all Restricted Stock will be held at the Company’s transfer agent in book entry form with appropriate restrictions relating to the transfer of such Restricted Stock. (iv)7. DividendsRestricted Stock Units. The Committee may, from time to time and Splits. As a condition toupon such terms and conditions as it may determine, authorize the grant of an Awardgranting or sale of Restricted Stock Units to Participants. Each such grant or sale may utilize any or all of the authorizations, and will be subject to all of the requirements, contained in the following provisions:
(a) Each such grant or sale will constitute the agreement by the Company to deliver shares of Common Stock or cash, or a combination thereof, to the Participant in the future in consideration of the performance of services, but subject to the fulfillment of such conditions (which may include the achievement of Management Objectives) during the Restriction Period as the Committee may requirespecify. (b) Each such grant or sale may be made without additional consideration or in consideration of a payment by such Participant that is less than the Market Value per Share on the Date of Grant. (c) Notwithstanding anything to the contrary contained in this Plan, Restricted Stock Units may provide for continued vesting or the earlier lapse or other modification of the Restriction Period, including in the event of the retirement, death or Disability of a Participant. (d) During the Restriction Period, the Participant will have no right to transfer any cash dividends paidrights under his or her award and will have no rights of ownership in the shares of Common Stock deliverable upon payment of the Restricted Stock Units and will have no right to vote them, but the Committee may, at or after the Date of Grant, authorize the payment of dividend equivalents on such Restricted Stock Units on a share of Restricted Stock be automatically reinvesteddeferred and contingent basis, either in cash or in additional shares of Common Stock;provided,however, that dividend equivalents or other distributions on shares of Common Stock underlying Restricted Stock Units will be deferred until and paid contingent upon the vesting of such Restricted Stock Units. (e) Each grant or appliedsale of Restricted Stock Units will specify the time and manner of payment of the Restricted Stock Units that have been earned. Each grant or sale will specify that the amount payable with respect thereto will be paid by the Company in shares of Common Stock or cash, or a combination thereof. (f) Each grant or sale of Restricted Stock Units will be evidenced by an Evidence of Award. Each Evidence of Award will be subject to this Plan and will contain such terms and provisions, consistent with this Plan, as the purchaseCommittee may approve. 8. Cash Incentive Awards, Performance Shares and Performance Units. The Committee may, from time to time and upon such terms and conditions as it may determine, authorize the granting of additionalCash Incentive Awards, underPerformance Shares and Performance Units. Each such grant may utilize any or all of the Plan. Unless otherwiseauthorizations, and will be subject to all of the requirements, contained in the following provisions: (a) Each grant will specify the number or amount of Performance Shares or Performance Units, or amount payable with respect to a Cash Incentive Award, to which it pertains, which number or amount may be subject to adjustment to reflect changes in compensation or other factors. (b) The Performance Period with respect to each Cash Incentive Award or grant of Performance Shares or Performance Units will be such period of time as will be determined by the Committee, Stock distributed in connection with a Stock split or Stock dividend, and other property distributed as a dividend, shallwhich may be subject to restrictionscontinued vesting or earlier lapse or other modification, including in the event of the retirement, death or Disability of a Participant. (c) Each grant of a Cash Incentive Award, Performance Shares or Performance Units will specify Management Objectives which, if achieved, will result in payment or early payment of the award, and each grant may specify in respect of such specified Management Objectives a riskminimum acceptable level or levels of forfeitureachievement and may set forth a formula for determining the number of Performance Shares or Performance Units, or amount payable with respect to a Cash Incentive Award, that will be earned if performance is at or above the minimum or threshold level or levels, or is at or above the target level or levels, but falls short of maximum achievement of the specified Management Objectives. (d) Each grant will specify the time and manner of payment of a Cash Incentive Award, Performance Shares or Performance Units that have been earned. Any grant may specify that the amount payable with respect thereto may be paid by the Company in cash, in shares of Common Stock, in Restricted Stock or Restricted Stock Units or in any combination thereof. (e) Any grant of a Cash Incentive Award, Performance Shares or Performance Units may specify that the amount payable or the number of shares of Common Stock, Restricted Stock or Restricted Stock Units payable with respect thereto may not exceed a maximum specified by the Committee on the Date of Grant. (f) The Committee may, on the Date of Grant of Performance Shares or Performance Units, provide for the payment of dividend equivalents to the same extentholder thereof either in cash or in additional shares of Common Stock, subject in all cases to deferral and payment on a contingent basis based on the Participant’s earning of the Performance Shares or Performance Units, as the Restricted Stockapplicable, with respect to which such Stock or other property has been distributed.dividend equivalents are paid. (e)Deferred Stock Units. The Committee is authorized to(g) Each grant Deferred Stock Units to Participants, which are rights to receive Stock, cash, or a combination thereof at the end of a specified time period, subject to the following terms and conditions:
(i)Cash Incentive Award, and Restrictions. SatisfactionPerformance Shares or Performance Units will be evidenced by an Evidence of anAward. Each Evidence of Award of Deferred Stock Units shall occur upon expiration of the time specified for such Deferred Stock Units by the Committee (or, if permitted by the Committee, as elected by the Participant). In addition, subject to Section 4(c), Deferred Stock Units shallwill be subject to this Plan and will contain such restrictions (which may include a risk of forfeiture)terms and provisions, consistent with this Plan, as the Committee may impose, if any, which restrictions may lapse atapprove.
9. Other Awards. (a) Subject to applicable law and the expirationapplicable limits set forth in Section 3 of the time period or at earlier specified times (including based on achievement of performance goals and/or future service requirements), separately or in combination, in installments or otherwise, asthis Plan, the Committee may determine. The terms of an Award of Deferred Stock Units shall be set forth in a written Award Agreement that shall contain provisions determined byauthorize the Committee and not inconsistent with the Plan. Deferred Stock Units may be satisfied by delivery of Stock, cash equalgrant to the Fair Market Value of the specified numberany Participant of shares of Stock covered by the Deferred Stock Units, or a combination thereof, as determined by the Committee at the date of grant or thereafter. Prior to satisfaction of an Award of Deferred Stock Units, an Award of Deferred Stock Units carries no voting or dividend or other rights associated with share ownership. (ii)Forfeiture. Except as otherwise determined by the Committee, upon termination of a Participant’s Continuous Service during the applicable time period thereof to which forfeiture conditions apply (as provided in the Award agreement evidencing the Deferred Stock Units), the Participant’s Deferred Stock Units (other than those Deferred Stock Units subject to deferral at the election of the Participant) shall be forfeited; provided that the Committee may provide, by rule or regulation or in any Award agreement, or may determine in any individual case, that restrictions or forfeiture conditions relating to Deferred Stock Units shall be waived in whole or in part in the event of terminations resulting from specified causes, and the Committee may in other cases waive in whole or in part the forfeiture of Deferred Stock Units.
(iii)Dividend Equivalents. Unless otherwise determined by the Committee at date of grant, any Dividend Equivalents that are granted with respect to any Award of Deferred Stock Units shall be either (A) paid with respect to such Deferred Stock Units at the dividend payment date in cash or in shares of unrestricted Stock having a Fair Market Value equal to the amount of such dividends, or (B) deferred with respect to such Deferred Stock Units and the amount or value thereof automatically deemed reinvested in additional Deferred Stock Units, other Awards or other investment vehicles, as the Committee shall determine or permit the Participant to elect. Unless otherwise determined by the Committee, Stock distributed in connection with a Stock split or Stock dividend, and other cash or property distributed as a dividend, shall be subject to restrictions and a risk of forfeiture to the same extent as the Deferred Stock Unit with respect to which suchCommon Stock or other property has been distributed.
(f)Bonus Stock and Awards in Lieu of Obligations. The Committee is authorized to grant Stock as a bonus, or to grant Stock or other Awards in lieu of Company obligations to pay cash or deliver other property under the Plan or under other plans, provided that, in the case of Participants subject to Section 16 of the Exchange Act, the amount of such grants
remains within the discretion of the Committee to the extent necessary to ensure that acquisitions of Stock or other Awards are exempt from liability under Section 16(b) of the Exchange Act. Stock or Awards granted hereunder shall be subject to such other terms as shall be determined by the Committee.
(g)Dividend Equivalents. The Committee is authorized to grant Dividend Equivalents to a Participant entitling the Participant to receive cash, Stock, other Awards, or other property equal in value to dividends paid with respect to a specified number of shares of Stock, or other periodic payments. Dividend Equivalents may be awarded on a free-standing basis or in connection with another Award. The Committee may provide that Dividend Equivalents shall be paid or distributed when accrued or shall be deemed to have been reinvested in additional Stock, Awards, or other investment vehicles, and subject to such restrictions on transferability and risks of forfeiture, as the Committee may specify. Unless otherwise determined by the Committee, Stock distributed in connection with a Stock split or Stock dividend, and other cash or property distributed as a dividend, shall be subject to restrictions and a risk of forfeiture to the same extent as the underlying Dividend Equivalents.
(h)Other Stock-Based Awards. The Committee is authorized, subject to limitations under applicable law, to grant to Participants such other Awardsawards that may be denominated or payable in, valued in whole or in part by reference to, or otherwise based on, or related to, shares of Common Stock as deemed byor factors that may influence the Committee to be consistent with the purposesvalue of the Plan,such shares, including, without limitation, convertible or exchangeable debt securities, other rights convertible or exchangeable into shares of Common Stock, purchase rights for shares of Common Stock, Awardsawards with value and payment contingent upon performance of the Company or specified Subsidiaries, affiliates or other business units thereof or any other factors designated by the Committee, and Awardsawards valued by reference to the book value of the shares of Common Stock or the value of securities of, or the performance of specified Related EntitiesSubsidiaries or affiliates or other business units.units of the Company. The Committee shallwill determine the terms and conditions of such Awards.awards. Shares of Common Stock delivered pursuant to an Awardaward in the nature of a purchase right granted under this Section 6(h) shall9 will be purchased for such consideration, (including without limitation loans from the Company or a Related Entity), paid for at such times,time, by such methods, and in such forms, including, without limitation, cash,shares of Common Stock, other Awardsawards, notes or other property, as the Committee shall determine. The Committee shall have the discretion to grant such other Awards which are exercisable for unvested shares of Common Stock. Should the Optionee’s Continuous Service cease while holding such unvested shares, the Company shall have the right to repurchase, at the exercise price paid per share, any or all of those unvested shares. The terms upon which such repurchase right shall be exercisable (including the period and procedure for exercise and the appropriate vesting schedule for the purchased shares) shall be established by the Committee and set forth in the document evidencing such repurchase right.determines.
(b) Cash awards, as an element of or supplement to any other Awardaward granted under thethis Plan, may also be granted pursuant to this Section 6(h).9. 7.Performance and Annual Incentive Awards.
(a)Performance Conditions.(c) The rightCommittee may authorize the grant of shares of Common Stock as a Participantbonus, or may authorize the grant of other awards in lieu of obligations of the Company or a Subsidiary to exercisepay cash or receive a grantdeliver other property under this Plan or settlement of any Award, and the timing thereof, may beunder other plans or compensatory arrangements, subject to such performance conditionsterms as will be determined by the Committee in a manner that complies with Section 409A of the Code.
(d) The Committee may, at or after the Date of Grant, authorize the payment of dividends or dividend equivalents on awards granted under this Section 9 on a deferred and contingent basis, either in cash or in additional shares of Common Stock; provided, however, that dividend equivalents or other distributions on shares of Common Stock underlying awards granted under this Section 9 will be specifieddeferred until and paid contingent upon the earning of such awards. (e) Notwithstanding anything to the contrary contained in this Plan, awards under this Section 9 may provide for the earning or vesting of, or earlier elimination of restrictions applicable to, such award, including in the event of the retirement, death or Disability of a Participant. 10. Administration of this Plan. (a) This Plan will be administered by the Committee. The Committee may usefrom time to time delegate all or any part of its authority under this Plan to a subcommittee thereof. To the extent of any such business criteriadelegation, references in this Plan to the Committee will be deemed to be references to such subcommittee. (b) The interpretation and construction by the Committee of any provision of this Plan or of any Evidence of Award (or related documents) and any determination by the Committee pursuant to any provision of this Plan or of any such agreement, notification or document will be final and conclusive. No member of the Committee shall be liable for any such action or determination made in good faith. In addition, the Committee is authorized to take any action it determines in its sole discretion to be appropriate subject only to the express limitations contained in this Plan, and no authorization in any Plan section or other measuresprovision of performancethis Plan is intended or may be deemed to constitute a limitation on the authority of the Committee. (c) To the extent permitted by law, the Committee may delegate to one or more of its members, to one or more officers of the Company, or to one or more agents or advisors, such administrative duties or powers as it may deem appropriate in establishing any performance conditions,advisable, and may exercise its discretion to reduce the amounts payable under any Award subject to performance conditions, except as limited under Sections 7(b) and 7(c) hereof in the case of a Performance Award or Annual Incentive Award intended to qualify under Code Section 162(m). (b)Performance Awards Granted to Designated Covered Employees. If and to the extent that the Committee, determinesthe subcommittee, or any person to whom duties or powers have been delegated as aforesaid, may employ one or more persons to render advice with respect to any responsibility the Committee, the subcommittee or such person may have under this Plan. The Committee may, by resolution, authorize one or more officers of the Company to do one or both of the following on the same basis as the Committee: (i) designate employees to be recipients of awards under this Plan; and (ii) determine the size of any such awards;provided,however, that a Performance Award(A) the Committee will not delegate such responsibilities to beany such officer for awards granted to an Eligible Personemployee who is designated by the Committee as likely to be a Covered Employee should qualify as “performance-based compensation” for purposes of Code Section 162(m), the grant, exercise and/or settlement of such Performance Award shall be contingent upon achievement of pre-established performance goals and other terms set forth in this Section 7(b).
(i)Performance Goals Generally. The performance goals for such Performance Awards shall consist of onean officer, Director, or more business criteria and a targeted level or levels of performance with respect to each ofthan 10% “beneficial owner” (as such criteria, as specified byterm is defined in Rule13d-3 promulgated under the Committee consistent with this Section 7(b). Performance goals shall be objective and shall otherwise meet the requirements of Code Section 162(m) and regulations thereunder including the requirement that the level or levels of performance targeted by the Committee result in the achievement of performance goals being “substantially uncertain.” The Committee may determine that such Performance Awards shall be granted, exercised and/or settled upon achievementExchange Act) of any one performance goal or that two or moreclass of the performance goals must be achieved as a conditionCompany’s equity securities that is registered pursuant to grant, exercise and/or settlement of such Performance Awards. Performance goals may differ for Performance Awards granted to any one Participant or to different Participants.
(ii)Business Criteria. One or moreSection 12 of the following business criteria for the Company, on a consolidated basis, and/or specified Related Entities or business units of the Company (except with respect to the total stockholder return and earnings per share criteria), shall be used exclusively by the Committee in establishing performance goals for such Performance Awards: (1) total stockholder return; (2) such total stockholder returnExchange Act, as compared to total return (on a comparable basis) of a publicly available index such as, but not limited to, the Standard & Poor’s 500 Stock Index, the S&P
Specialty Retailer Index or the Philadelphia Semiconductor Index; (3) net income; (4) pretax earnings; (5) earnings before interest expense, taxes, depreciation and amortization; (6) pretax operating earnings after interest expense and before bonuses, service fees, and extraordinary or special items; (7) operating margin; (8) earnings per share; (9) return on equity; (10) return on capital; (11) return on investment; (12) operating earnings; (13) working capital or inventory; (14) operating earnings before the expense for share based awards; and (15) ratio of debt to stockholders’ equity. One or more of the foregoing business criteria shall also be exclusively used in establishing performance goals for Annual Incentive Awards granted to a Covered Employee under Section 7(c) hereof that are intended to qualify as “performance-based compensation under Code Section 162(m).
(iii)Performance Period; Timing For Establishing Performance Goals. Achievement of performance goals in respect of such Performance Awards shall be measured over a performance period of up to seven years, as specified by the Committee. Performance goals shall be established not later than 90 days after the beginning of any performance period applicable to such Performance Awards, or at such other date as may be required or permitted for “performance-based compensation” under Code Section 162(m).
(iv)Performance Award Pool. The Committee may establish a Performance Award pool, which shall be an unfunded pool, for purposes of measuring Company performance in connection with Performance Awards. The amount of such Performance Award pool shall be based upon the achievement of a performance goal or goals based on one or more of the business criteria set forth in Section 7(b)(ii) hereof during the given performance period, as specifieddetermined by the Committee in accordance with Section 7(b)(iii) hereof.16 of the Exchange Act; (B) the resolution providing for such authorization shall set forth the total number of shares of Common Stock such officer(s) may grant; and (C) the officer(s) will report periodically to the Committee regarding the nature and scope of the awards granted pursuant to the authority delegated.
11. Adjustments. The Committee may specifyshall make or provide for such adjustments in the amountnumber of and kind of shares of Common Stock covered by outstanding Option Rights, Appreciation Rights, Restricted Stock, Restricted Stock Units, Performance Shares and Performance Units granted hereunder and, if applicable, in the number of and kind of shares of Common Stock covered by other awards granted pursuant to Section 9 of this Plan, in the Option Price and Base Price provided in outstanding Option Rights and Appreciation Rights, respectively, in Cash Incentive Awards, and in other award terms, as the Committee, in its sole discretion, exercised in good faith, determines is equitably required to prevent dilution or enlargement of the Performance Award pool as a percentagerights of Participants that otherwise would result from (a) any extraordinary cash dividend, stock dividend, stock split, combination of shares, recapitalization or other change in the capital structure of the Company, (b) any merger, consolidation,spin-off,split-off,spin-out,split-up, reorganization, partial or complete liquidation or other distribution of assets, issuance of rights or warrants to purchase securities, or (c) any other corporate transaction or event having an effect similar to any of the foregoing. Moreover, in the event of any of such business criteria, a percentage thereoftransaction or event or in excessthe event of a threshold amount,Change in Control, the Committee may provide in substitution for any or all outstanding awards under this Plan such alternative consideration (including cash), if any, as another amount which need not bear a strictly mathematical relationshipit, in good faith, may determine to such business criteria. (v)Settlement of Performance Awards; Other Terms. Settlement of such Performance Awards shall be in cash, Stock, other Awards or other property,equitable in the discretioncircumstances and shall require in connection therewith the surrender of all awards so replaced in a manner that complies with Section 409A of the Committee. TheCode. In addition, for each Option Right or Appreciation Right with an Option Price or Base Price, respectively, greater than the consideration offered in connection with any such transaction or event or Change in Control, the Committee may in its discretion reduceelect to cancel such Option Right or Appreciation Right without any payment to the amount of a settlement otherwise to be made in connection withperson holding such Performance Awards.Option Right or Appreciation Right. The Committee shall specify the circumstances in whichalso make or provide for such Performance Awards shall be paid or forfeitedadjustments in the number of shares of Common Stock specified in Section 3 of this Plan as the Committee in its sole discretion, exercised in good faith, determines is appropriate to reflect any transaction or event of termination of Continuous Service by the Participant prior to the end of a performance period or settlement of Performance Awards.
(c)Annual Incentive Awards Granted to Designated Covered Employees. The Committee may, within its discretion, grant one or more Annual Incentive Awards to any Eligible Person, subject to the terms and conditions set forthdescribed in this Section 7(c).
(i)Annual Incentive Award Pool. The Committee may establish an Annual Incentive Award pool, which shall be an unfunded pool, for purposes of measuring Company performance in connection with Annual Incentive Awards. In11; provided, however, that any such adjustment to the case of Annual Incentive Awards intended to qualify as “performance-based compensation” for purposes of Code Section 162(m), the amount of such Annual Incentive Award pool shall be based upon the achievement of a performance goal or goals based on one or more of the business criteria set forthnumber specified in Section 7(b)(ii) hereof during the given performance period, as specified by the Committee in accordance with Section 7(b)(iii) hereof. The Committee may specify the amount3(c) of the Annual Incentive Award pool as a percentage of any such business criteria, a percentage thereof in excess of a threshold amount, or as another amount which need not bear a strictly mathematical relationship to such business criteria.
(ii)Potential Annual Incentive Awards. Not later than the end of the 90th day of each fiscal year, or at such other date as may be required or permitted in the case of Awards intended to be “performance-based compensation” under Code Section 162(m), the Committee shall determine the Eligible Persons whothis Plan will potentially receive Annual Incentive Awards, and the amounts potentially payable thereunder, for that fiscal year, either out of an Annual Incentive Award pool established by such date under Section 7(c)(i) hereof or as individual Annual Incentive Awards. In the case of individual Annual Incentive Awards intended to qualify under Code Section 162(m), the amount potentially payable shall be based upon the achievement of a performance goal or goals based on one or more of the business criteria set forth in Section 7(b)(ii) hereof in the given performance year, as specified by the Committee; in other cases, such amount shall be based on such criteria as shall be established by the Committee. In all cases, the maximum Annual Incentive Award of any Participant shall be subject to the limitation set forth in Section 5 hereof.
(iii)Payout of Annual Incentive Awards. After the end of each fiscal year, the Committee shall determine the amount, if any, of (A) the Annual Incentive Award pool, and the maximum amount of potential Annual Incentive Award payable to each Participant in the Annual Incentive Award pool, or (B) the amount of potential Annual Incentive Award otherwise payable to each Participant. The Committee shall specify the circumstances in which an Annual Incentive Award shall be paid or forfeited in the event of termination of Continuous Service by the Participant prior to the end of a fiscal year or settlement of such Annual Incentive Award.
(d)Written Determinations. All determinations by the Committee as to the establishment of performance goals, the amount of any Performance Award pool or potential individual Performance Awards and as to the achievement of performance goals relating to Performance Awards under Section 7(b), and the amount of any Annual Incentive Award pool or potential individual Annual Incentive Awards and the amount of final Annual Incentive Awards under Section 7(c), shall be made in writing in the case of any Award intended to qualify under Code Section 162(m). The Committee may not delegate any responsibility relating to such Performance Awards or Annual Incentive Awardsonly if and to the extent that such adjustment would not cause any Option Right intended to qualify as an Incentive Stock Option to fail to so qualify.
12. Definition and Effect of a Change in Control. (a) For purposes of this Plan, except as may be otherwise prescribed by the Committee in an Evidence of Award made under this Plan, a “Change in Control” will be deemed to have occurred upon the occurrence (after the Effective Date) of any of the following events: | (i) | a change in control of a nature that would be required to be reported in response to Item 6(e) of Schedule 14A of Regulation 14A promulgated under the Exchange Act, or if Item 6(e) is no longer in effect, any regulations issued by the Securities and Exchange Commission pursuant to the Exchange Act which serve similar purposes; |
| (ii) | the following individuals no longer constitute a majority of the members of the Board: (1) the individuals who, as of the Effective Date, constitute the Board (the “Current Directors”); (2) the individuals who thereafter are elected to the Board and whose election, or nomination for election, to the Board was approved by a vote of a majority of all of the Current Directors then still in office (such directors becoming “Additional Directors” immediately following their election); and (3) the individuals who are elected to the Board and whose election, or nomination for election, to the Board was approved by a vote of a majority of all of the Current Directors and Additional Directors then still in office (such directors also becoming “Additional Directors” immediately following their election); |
| (iii) | a tender offer or exchange offer is made whereby the effect of such offer is to take over and control the Company, and such offer is consummated for the equity securities of the Company representing more than 50% of the combined voting power of the Company’s then outstanding voting securities; |
| (iv) | the consummation of a transaction approved by the Stockholders of a merger, consolidation, recapitalization, or reorganization of the Company, a reverse stock split of outstanding voting securities, or consummation of any such transaction if Stockholder approval is not obtained, other than any such transaction that would result in more than 50% of the total voting power represented by the voting securities of the surviving entity outstanding immediately after such transaction being beneficially owned by the holders of outstanding voting securities of the Company immediately prior to the transaction, with the voting power of each such continuing holder relative to other such continuing holders not substantially altered in the transaction; |
| (v) | the consummation of a transaction approved by the Stockholders of a plan of complete liquidation of the Company or an agreement for the sale or disposition by the Company of all or a substantial portion of the Company’s assets to another person, which is not a wholly owned subsidiary of the Company (i.e., 50% or more of the total assets of the Company); or |
| (vi) | any “person” (as that term is used in Sections 13(d) and 14(d) of the Exchange Act) is or becomes the “beneficial owner” (as defined in Rule13d-3 of the Exchange Act), directly or indirectly of more than 50% of the total voting power represented by the Company’s then outstanding voting securities. |
(b) Unless otherwise provided in an Evidence of Award or another written agreement between a Participant and the Company and notwithstanding the Plan’s minimum vesting requirements, if a Change in Control occurs, then: | (i) | Option Rights and Appreciation Rights issued that are not yet fully vested and exercisable as of the time of the Change in Control shall immediately become vested and exercisable in full, except to the extent that a Replacement Award is provided to the Participant in accordance with the terms described herein; |
| (ii) | Any restrictions, deferral of settlement and forfeiture conditions applicable to Restricted Stock, Restricted Stock Units, or other awards granted under Section 9 that vest solely based on continued service (and not based on the achievement of Management Objectives) shall lapse and such awards shall be deemed fully vested as of immediately prior to the Change in Control, except to the extent that a Replacement Award is provided to the Participant in accordance with the terms described herein; |
| (iii) | With respect to Cash Incentive Awards, Performance Shares, Performance Units, and other awards granted under the Plan that are subject to the achievement of Management Objectives (other than the awards described in Section 12(b)(iv) below), the Management Objectives applicable thereto shall be deemed satisfied at target and the applicable performance period shall be deemed completed as of immediately prior to the Change in Control. Such awards will remain outstanding and will vest thereafter pursuant to the service-based vesting schedule set forth in the applicable Evidence of Award unless the successor or acquiring entity in the Change in Control does not provide a Replacement Award. If such Replacement Award is not provided, then any remaining restrictions, |
| deferral of settlement and forfeiture conditions applicable to such award shall lapse and such award shall be deemed fully vested as of immediately prior to the Change in Control; and |
| (iv) | With respect to Restricted Stock Units granted with Management Objectives that the Company describes as “Market Stock Units,” a prorated portion of such Market Stock Units shall vest based on actual performance of the Management Objectives through the date of the Change in Control. The remainder of the Market Stock Units (that did not vest in accordance with the immediately preceding sentence) will vest in accordance with their regular vesting schedule as set forth in the Evidence of Award unless the successor or acquiring entity in the Change in Control does not provide a Replacement Award for such remaining Market Stock Units. If such Replacement Award is not provided, then any remaining restrictions, deferral of settlement and forfeiture conditions applicable to such Market Stock Units shall lapse and such Market Stock Units shall be deemed fully vested as of immediately prior to the Change in Control. |
13. Clawback/Recovery.All awards (cash and equity) held by the Company’s Executive Officers shall be subject to clawback, recoupment or forfeiture (a) to the extent that such Executive Officer is determined to have engaged in fraud or intentional illegal conduct that caused the Company’s materialnon-compliance with any applicable financial reporting requirements and resulted in a financial restatement, the result of which is that the amount received from such award would have been lower had it been calculated on the basis of such restated results, or (b) required by applicable laws, rules, regulations or listing requirements. Such clawback, recoupment or forfeiture, in addition to any other remedies available under applicable laws, rules, regulations or listing requirements, shall occur through the cancellation of such awards (to the extent then-outstanding), the recoupment of any gains realized with respect to such awards, or a combination of the foregoing, to the extent of the overpayment. All awards granted under the Plan will also be subject to recoupment in accordance with any clawback policy that the Company is required to complyadopt pursuant to the listing standards of any national securities exchange or association on which the Company’s securities are listed or as is otherwise required by the Dodd-Frank Wall Street Reform and Consumer Protection Act or other applicable law. The implementation of any clawback policy will not be deemed a triggering event for purposes of any definition of “good reason” for resignation or any “constructive termination.” 14. Non-U.S. Participants. In order to facilitate the making of any grant or combination of grants under this Plan, the Committee may provide for such special terms for awards to Participants who are foreign nationals or who are employed by the Company or any Subsidiary outside of the United States of America or who provide services to the Company or any Subsidiary under an agreement with Code Section 162(m). (e)Statusa foreign nation or agency, as the Committee may consider necessary or appropriate to accommodate differences in local law, tax policy or custom. Moreover, the Committee may approve such supplements to or amendments, restatements or alternative versions of Section 7(b)this Plan (includingsub-plans) as it may consider necessary or appropriate for such purposes, without thereby affecting the terms of this Plan as in effect for any other purpose, and Section 7(c) Awards Under Code Section 162(m). It is the intentsecretary or other appropriate officer of the Company may certify any such document as having been approved and adopted in the same manner as this Plan. No such special terms, supplements, amendments or restatements, however, will include any provisions that Performance Awards and Annual Incentive Awards under Section 7(b) and 7(c) hereof grantedare inconsistent with the terms of this Plan as then in effect unless this Plan could have been amended to persons who are designatedeliminate such inconsistency without further approval by the Stockholders.
15. Transferability. (a) Except as otherwise determined by the Committee, no Option Right, Appreciation Right, Restricted Stock, Restricted Stock Unit, Performance Share, Performance Unit, Cash Incentive Award, award contemplated by Section 9 of this Plan or dividend equivalents paid with respect to awards made under this Plan will be transferable by the Participant except by will or the laws of descent and distribution. In no event will any such award granted under this Plan be transferred for value. Except as likely to be Covered Employees within the meaning of Code Section 162(m) and regulations thereunder shall, if so designatedotherwise determined by the Committee, constitute “qualified performance-based compensation” withinOption Rights and Appreciation Rights will be exercisable during the meaningParticipant’s lifetime only by him or her or, in the event of the Participant’s legal incapacity to do so, by his or her guardian or legal representative acting on behalf of the Participant in a fiduciary capacity under state law or court supervision. (b) The Committee may specify on the Date of Grant that part or all of the shares of Common Stock that are (i) to be issued or transferred by the Company upon the exercise of Option Rights or Appreciation Rights, upon the termination of the Restriction Period applicable to Restricted Stock Units or upon payment under any grant of Performance Shares or Performance Units or (ii) no longer subject to the substantial risk of forfeiture and restrictions on transfer referred to in Section 6 of this Plan, will be subject to further restrictions on transfer. 16. Withholding Taxes. To the extent that the Company is required to withhold federal, state, local or foreign taxes in connection with any payment made or benefit realized by a Participant or other person under this Plan, and the amounts available to the Company for such withholding are insufficient, it will be a condition to the receipt of such payment or the realization of such benefit that the Participant or such other person make arrangements satisfactory to the Company for payment of the balance of such taxes required to be withheld, which arrangements (in the discretion of the Committee) may include relinquishment of a portion of such benefit. If a Participant’s benefit is to be received in the form of Common Stock, then, unless otherwise determined by the Committee, the Company will withhold from the shares required to be delivered to the Participant, shares of Common Stock having a value equal to the amount required to be withheld under applicable income and employment tax laws. The shares used for tax withholding will be valued at an amount equal to the market value of such shares of Common Stock on the date the benefit is to be included in the Participant’s income. In no event will the market value of the shares of Common Stock to be withheld and delivered pursuant to this Section to satisfy applicable withholding obligations exceed the minimum amount required to be withheld, unless (i) an additional amount can be withheld and not result in adverse accounting consequences, (ii) such additional withholding amount is authorized by the Committee, and (iii) the total amount withheld does not exceed the Participant’s estimated tax obligations attributable to the applicable transaction. Participants will also make such arrangements as the Committee may require for the payment of any withholding obligation that may arise in connection with the disposition of shares of Common Stock acquired upon the exercise of Option Rights. 17. Compliance with Section 409A of the Code. (a) To the extent applicable, it is intended that this Plan and any grants made hereunder comply with the provisions of Section 409A of the Code, so that the income inclusion provisions of Section 162(m)409A(a)(1) of the Code do not apply to the Participants. This Plan and regulations thereunder. Accordingly, the terms of Sections 7(b), (c), (d) and (e), including the definitions of Covered Employee and other terms used therein, shallany grants made hereunder will be interpretedadministered in a manner consistent with this intent. Any reference in this Plan to Section 409A of the Code will also include any regulations or any other formal guidance promulgated with respect to such section by the U.S. Department of the Treasury or the Internal Revenue Service. (b) Neither a Participant nor any of a Participant’s creditors or beneficiaries will have the right to subject any deferred compensation (within the meaning of Section 162(m)409A of the Code) payable under this Plan and regulations thereunder. The foregoing notwithstanding, becausegrants hereunder to any anticipation, alienation, sale, transfer, assignment, pledge, encumbrance, attachment or garnishment. Except as permitted under Section 409A of the Committee cannot determine with certainty whetherCode, any deferred compensation (within the meaning of Section 409A of the Code) payable to a givenParticipant or for a Participant’s benefit under this Plan and grants hereunder may not be reduced by, or offset against, any amount owed by a Participant to the Company or any of its Subsidiaries. (c) If, at the time of a Participant’s separation from service (within the meaning of Section 409A of the Code), (i) the Participant will be a Covered Employeespecified employee (within the meaning of Section 409A of the Code and using the identification methodology selected by the Company from time to time) and (ii) the Company makes a good faith determination that an amount payable hereunder constitutes deferred compensation (within the meaning of Section 409A of the Code) the payment of which is required to be delayed pursuant to thesix-month delay rule set forth in Section 409A of the Code in order to avoid taxes or penalties under Section 409A of the Code, then the Company will not pay such amount on the otherwise scheduled payment date but will instead pay it, without interest, on the fifth business day of the seventh month after such separation from service. (d) Solely with respect to a fiscal yearany award that has not yet been completed, the term Covered Employee as used herein shall mean only a person designated by the Committee, at the time of grant of Performance Awards or an Annual Incentive Award, as likelyconstitutes nonqualified deferred compensation subject to be a Covered Employee with respect to that fiscal year. If any provisionSection 409A of the PlanCode and that is payable on account of a Change in Control (including any installments or any agreement relating tostream of payments that are accelerated on account of a Change in Control), a Change in Control shall occur only if such Performance Awards event also constitutes a “change in the ownership,” “change in effective control,” and/or Annual Incentive Awards does not comply or is inconsistent witha “change in the requirementsownership of Code Section 162(m) or regulations thereunder, such provision shall be construed or deemed amendeda substantial portion of assets” of the Company as those terms are defined under Treasury Regulation§1.409A-3(i)(5), but only to the extent necessary to conformestablish a time and form of payment that complies with Section 409A of the Code, without altering the definition of Change in Control for any purpose in respect of such award. (e) Notwithstanding any provision of this Plan and grants hereunder to the contrary, in light of the uncertainty with respect to the proper application of Section 409A of the Code, the Company reserves the right to make amendments to this Plan and grants hereunder as the Company deems necessary or desirable to avoid the imposition of taxes or penalties under Section 409A of the Code. In any case, a Participant will be solely responsible and liable for the satisfaction of all taxes and penalties that may be imposed on a Participant or for a Participant’s account in connection with this Plan and grants hereunder (including any taxes and penalties under Section 409A of the Code), and neither the Company nor any of its affiliates will have any obligation to indemnify or otherwise hold a Participant harmless from any or all of such requirements.taxes or penalties. 8.18. Certain Provisions Applicable to Awards or SalesAmendments..
(a)Stand-Alone, Additional, Tandem, The Board may at any time and Substitutefrom time to time amend this Plan in whole or in part;provided,however, that if an amendment to this Plan, for purposes of applicable stock exchange rules and except as permitted under Section 11 of this Plan, (i) would materially increase the benefits accruing to Participants under this Plan, (ii) would materially increase the number of securities which may be issued under this Plan, (iii) would materially modify the requirements for participation in this Plan, or (iv) must otherwise be approved by the Stockholders in order to comply with applicable law or the rules of the Nasdaq Stock Market, or, if the shares of Common Stock are not traded on the Nasdaq Stock Market, the principal national securities exchange upon which the shares of Common Stock are traded or quoted, all as determined by the Board, then, such amendment will be subject to Stockholder approval and will not be effective unless and until such approval has been obtained. (b) Except in connection with a corporate transaction or event described in Section 11 of this Plan or in connection with a Change in Control, the terms of outstanding awards may not be amended to reduce the Option Price of outstanding Option Rights or the Base Price of outstanding Appreciation Rights, or cancel outstanding “underwater” Option Rights or Appreciation Rights in exchange for cash, other awards or Option Rights or Appreciation Rights with an Option Price or Base Price, as applicable, that is less than the Option Price of the original Option Rights or Base Price of the original Appreciation Rights, as applicable, without Stockholder approval. This Section 18(b) is intended to prohibit the repricing of “underwater” Option Rights and Appreciation Rights and will not be construed to prohibit the adjustments provided for in Section 11 of this Plan. Notwithstanding any provision of this Plan to the contrary, this Section 18(b) may not be amended without approval by the Stockholders. (c) If permitted by Section 409A of the Code, but subject to the paragraph that follows, including in the case of termination of employment or service, or in the case of unforeseeable emergency or other circumstances or in the event of a Change in Control, to the extent a Participant holds an Option Right or Appreciation Right not immediately exercisable in full, or any Restricted Stock as to which the substantial risk of forfeiture or the prohibition or restriction on transfer has not lapsed, or any Restricted Stock Units as to which the Restriction Period has not been completed, or any Cash Incentive Awards, Performance Shares or Performance Units which have not been fully earned, or any dividend equivalents or other awards made pursuant to Section 9 of this Plan subject to any vesting schedule or transfer restriction, or who holds shares of Common Stock subject to any transfer restriction imposed pursuant to Section 15(b) of this Plan, the Committee may, in its sole discretion, provide for continued vesting or accelerate the time at which such Option Right, Appreciation Right or other award may be exercised or the time at which such substantial risk of forfeiture or prohibition or restriction on transfer will lapse or the time when such Restriction Period will end or the time at which such Cash Incentive Awards, Performance Shares or Performance Units will be deemed to have been fully earned or the time when such transfer restriction will terminate or may waive any other limitation or requirement under any such award. (d) Subject to Section 18(b) of this Plan, the Committee may amend the terms of any award theretofore granted under this Plan prospectively or retroactively. Except for adjustments made pursuant to Section 11 of this Plan, no such amendment will impair the rights of any Participant without his or her consent. The Board may, in its discretion, terminate this Plan at any time. Termination of this Plan will not affect the rights of Participants or their successors under any awards outstanding hereunder and not exercised in full on the date of termination. 19. Governing Law.. Awards This Plan and all grants and awards and actions taken hereunder will be governed by and construed in accordance with the internal substantive laws of the State of Delaware. 20. Effective Date/Termination. This Plan will be effective as of the Effective Date. No grants will be made on or after the Effective Date under the Predecessor Plans, provided that outstanding awards granted under the Predecessor Plans will continue unaffected following the Effective Date. No grant will be made under this Plan on or after the tenth anniversary of the Effective Date, but all grants made prior to such date will continue in effect thereafter subject to the terms thereof and of this Plan. For clarification purposes, the terms and conditions of this Plan shall not apply to or otherwise impact previously granted and outstanding awards under the Predecessor Plans, as applicable. 21. Miscellaneous Provisions. (a) The Company will not be required to issue any fractional shares of Common Stock pursuant to this Plan. The Committee may provide for the elimination of fractions or for the settlement of fractions in cash. (b) This Plan will not confer upon any Participant any right with respect to continuance of employment or other service with the Company or any Subsidiary, nor will it interfere in any way with any right the Company or any Subsidiary would otherwise have to terminate such Participant’s employment or other service at any time. (c) Except with respect to Section 21(e) of this Plan, to the extent that any provision of this Plan would prevent any Option Right that was intended to qualify as an Incentive Stock Option from qualifying as such, that provision will be null and void with respect to such Option Right. Such provision, however, will remain in effect for other Option Rights and there will be no further effect on any provision of this Plan. (d) No award under this Plan may be exercised by the holder thereof if such exercise, and the receipt of cash or stock thereunder, would be, in the discretionopinion of counsel selected by the Committee, be granted either aloneCompany, contrary to law or in addition to, in tandem with, or in substitution or exchange for,the regulations of any other Award or any award granted under another planduly constituted authority having jurisdiction over this Plan. (e) Absence on leave approved by a duly constituted officer of the Company any Related Entity, or any business entityof its Subsidiaries will not be considered interruption or termination of service of any employee for any purposes of this Plan or awards granted hereunder. (f) No Participant will have any rights as a Stockholder with respect to be acquiredany shares of Common Stock subject to awards granted to him or her under this Plan prior to the date as of which he or she is actually recorded as the holder of such shares of Common Stock upon the stock records of the Company. (g) The Committee may condition the grant of any award or combination of awards authorized under this Plan on the surrender or deferral by the Participant of his or her right to receive a cash bonus or other compensation otherwise payable by the Company or a Related Entity, or any other right of a ParticipantSubsidiary to receive payment from the Company or any Related Entity. Such additional, tandem,Participant. (h) Except with respect to Option Rights and substitute or exchange Awards may be granted at any time. If an Award is granted in substitution or exchange for another Award or award,Appreciation Rights, the Committee shall requiremay permit Participants to elect to defer the surrenderissuance of shares of Common Stock under this Plan pursuant to such other Awardrules, procedures or award in considerationprograms as it may establish for purposes of this Plan and which are intended to comply with the grantrequirements of Section 409A of the new Award. In addition, AwardsCode. The Committee also may be granted in lieu of cash compensation, including in lieu of cash amounts payable under other plans ofprovide that deferred issuances and settlements include the Company or any Related Entity in which the value of Stock subject to the Award is equivalent in value to the cash compensation. (b)Term of Awards. The term of each Award shall be for such period as may be determined by the Committee or the Board; provided that in no event shall the term of any Option or Stock Appreciation Right exceed a period of seven years (or such shorter term as may be required in respect of an Incentive Stock Option under Section 422 of the Code).
(c)Form and Timing of Payment Under Awards; Deferrals. Subject to the terms of the Plan and any applicable Award agreement, payments to be made by the Company or a Related Entity upon the exercise of an Option or other Award or settlement of an Award may be made in such forms as the Committee shall determine, including, without limitation, cash, other Awards or other property, and may be made in a single payment or transfer, in installments, or on a deferred basis. The settlement of any Award may be accelerated, and cash paid in lieu of Stock in connection with such settlement, in the discretion of the Committee or upon occurrence of one or more specified events (in addition to a Change in Control). Installment or deferred payments may be required by the Committee (subject to Section 10(f) of the Plan) or permitted at the election of the Participant on terms and conditions established by the Committee. Payments may include, without limitation, provisions for the payment or crediting of a reasonabledividend equivalents or interest rate on installment or deferred payments or the grant or crediting of Dividend Equivalents or other amounts in respect of installment or deferred payments denominated in Stock.deferral amounts.
(d)Exemptions from Section 16(b) Liability. It is the intent of the Company that this Plan comply in all respects with applicable provisions of Rule 16b-3 or Rule 16a-1(c)(3) to the extent necessary to ensure that neither the grant of any Awards to nor other transaction by a Participant who is subject to Section 16 of the Exchange Act is subject to liability under Section 16(b) thereof (except for transactions acknowledged in writing to be non-exempt by such Participant). Accordingly, if(i) If any provision of this Plan is or becomes invalid or unenforceable in any jurisdiction, or would disqualify this Plan or any Award agreement does not comply withaward under any law deemed applicable by the requirements of Rule 16b-3 or Rule 16a-1(c)(3) as then applicable to any such transaction,Committee, such provision will be construed or deemed amended to the extent necessaryor limited in scope to conform to applicable laws or, in the applicable requirementsdiscretion of Rule 16b-3the Committee, it will be stricken and the remainder of this Plan will remain in full force and effect. Notwithstanding anything in this Plan or Rule 16a-1(c)(3) so that suchan Evidence of Award to the contrary, nothing in this Plan or in an Evidence of Award prevents a Participant shall avoid liabilityfrom providing, without prior notice to the Company, information to governmental authorities regarding possible legal violations or otherwise testifying or participating in any investigation or proceeding by any governmental authorities regarding possible legal violations, and for purpose of clarity a Participant is not prohibited from providing information voluntarily to the Securities and Exchange Commission pursuant to Section 21F of the Exchange Act.
22. Stock-Based Awards in Substitution for Awards Granted by Another Company. Notwithstanding anything in this Plan to the contrary: (a) Awards may be granted under Section 16(b). (e)Code Section 409A. Ifthis Plan in substitution for or in conversion of, or in connection with an assumption of, stock options, stock appreciation rights, restricted stock, restricted stock units or other stock or stock-based awards held by awardees of an entity engaging in a corporate acquisition or merger transaction with the Company or any Subsidiary. Any conversion, substitution or assumption will be effective as of the close of the merger or acquisition, and, to the extent applicable, will be conducted in a manner that the Committee believes that any Awards may constitute a “nonqualified deferred compensation plan” undercomplies with Section 409A of the Code,Code. The awards so granted may reflect the original terms of the awards being assumed or substituted or converted for and need not comply with other specific terms of this Plan, and may account for shares of Common Stock substituted for the securities covered by the original awards and the number of shares subject to the original awards, as well as any exercise or purchase prices applicable to the original awards, adjusted to account for differences in stock prices in connection with the transaction.
(b) In the event that a company acquired by the Company or any Subsidiary or with which the Company or any Subsidiary merges has shares available under apre-existing plan previously approved by stockholders and not adopted in contemplation of such acquisition or merger, the shares available for grant pursuant to the terms of such plan (as adjusted, to the extent appropriate, to reflect such acquisition or merger) may be used for awards made after such acquisition or merger under this Plan;provided,however, that awards using such available shares may not be made after the date awards or grants could have been made under the terms of thepre-existing plan absent the acquisition or merger, and conditions set forthmay only be made to individuals who were not employees or directors of the Company or any Subsidiary prior to such acquisition or merger. (c) Any shares of Common Stock that are issued or transferred by, or that are subject to any awards that are granted by, or become obligations of, the Company under Sections 22(a) or 22(b) of this Plan will not reduce the shares of Common Stock available for issuance or transfer under this Plan or otherwise count against the limits contained in Section 3 of this Plan. In addition, no shares of Common Stock subject to an award that is granted by, or becomes an obligation of, the Company under Sections 22(a) or 22(b) of this Plan will be added to the aggregate limit contained in Section 3(a)(i) of this Plan APPENDIX C 2019 EMPLOYEE STOCK PURCHASE PLAN 2019 Employee Stock Purchase Plan 1. Establishment, Purpose and Term of Plan. (a) Establishment. The Board adopted the Synaptics Incorporated 2019 Employee Stock Purchase Plan (the “Plan”) on July 30, 2019 (the “Effective Date”), subject to stockholder approval on or before the twelve (12) month anniversary of the Effective Date. If stockholder approval is not received by such date, the Plan will have no effect and any balance in a Participant’s Plan account will be returned to the Participant, without interest, as soon as administratively practicable thereafter. (b) Purpose. The purpose of the Plan is to provide Eligible Employees with an opportunity to acquire a proprietary interest in the Award Agreement forfuture of the Company through the purchase of Stock. The Company intends that Award shall be drafted in a manner that is intended to comply with, and shall be interpreted in a manner consistent with, the applicable requirements ofPlan qualify as an “employee stock purchase plan” under Section 409A423 of the Code unless otherwise agreed(including any amendments to such section) (“Section 423”), and the Plan shall be so construed. The Plan provides for both Section 423 andnon-Section 423 components. (c) Term of Plan. The Plan shall continue in writingeffect until the earliest of (i) its termination by the Participant andCommittee, (ii) the Company. (f)No Option Repricing. Other than pursuant to Section 10(c), without approvalissuance of the Company’s stockholders, the Committee shall not be permitted to (A) lower the exercise price per share ofall Stock of an Option or Stock Appreciation Right after it is granted, (B) cancel an Option or Stock Appreciation Right when the exercise price per share of Stock exceeds the Fair Market Value of the underlying share of Stock in exchangeavailable for another Award or cash, or (C) take any other action with respect to an Option or Stock Appreciation Right that may be treated as a repricing.
9.Change in Control.
(a)Effect of “Change in Control.” If and to the extent provided in the Award, in the event of a “Change in Control,” as defined in Section 9(b):
(i) The Committee may, within its discretion, accelerate the vesting and exercisability of any Award carrying a right to exercise that was not previously vested and exercisable as of the time of the Change in Control, subject to applicable restrictions set forth in Section 10(a) hereof;
(ii) The Committee may, within its discretion, accelerate the exercisability of any Stock Appreciation Rights and provide for the settlement of such Stock Appreciation Rights for amounts, in cash;
(iii) The Committee may, within its discretion, lapse the restrictions, deferral of settlement, and forfeiture conditions applicable to any other Award grantedissuance under the Plan and such Awards may be deemed fully vested as(iii) the day before the ten (10) year anniversary of the timeEffective Date.
2. Definitions and Construction. (a) Definitions. Any term not expressly defined in the Plan but defined for purposes of Section 423 shall have the same definition herein. Whenever used herein, the following terms shall have their respective meanings set forth below: (i) “Administrator” means the Committee or officer or employee of the Change in Control, exceptCompany to whom the Committee has delegated its authority under the Plan, to the extent permitted by applicable law. (ii) “Board” means the Board of any waiver by the Participant and subject to applicable restrictions set forth in Section 10(a) hereof; and (iv) With respect to any such outstanding Award subject to achievement of performance goals and conditions under the Plan, the Committee may, within its discretion, deem such performance goals and other conditions as having been met asDirectors of the date ofCompany.
(iii) “Business Day” means any day on which the Change in Control.national stock exchange on which the Stock is traded is available and open for trading. (b)Definition of(iv) “Change in Control.” A “Change in Control” shall be deemed to have occurred upon:means the occurrence of any of the following events:
(i) Upon(A) the consummation of a transaction approved by the stockholders of the Company of a reorganization, merger, consolidation or other form of corporate transaction or series of transactions, in each case, with respect to which persons who were the stockholders of the Company immediately prior to such reorganization, merger or consolidation or other transaction do not, immediately thereafter, own more than 50% of the combined voting power entitled to vote generally in the election of directors of the reorganized, merged or consolidated company’s then outstanding voting securities, or a liquidation or dissolution of the Company or the sale of all or substantially all of the assets of the Company;
(ii)(B) Individuals who, as of the date on which the Awardan award is granted, constitute the Board (the “Incumbent Board”“Incumbent Board”) cease for any reason to constitute at least a majority of the Board, provided that any person becoming a director subsequent to the date on which the Awardaward was granted whose election, or nomination for election by the Company’s stockholders, was approved by a vote of at least a majority of the directors then comprising the Incumbent Board (other than an election or nomination of an individual whose initial assumption of office is in connection with an actual or threatened election contest relating to the election of the Directorsdirectors of the Company) shall be, for purposes of this Agreement,agreement, considered as though such person were a member of the Incumbent Board; or
(iii)(C) the acquisition (other than from the Company) by any person, entity or “group”,“group,” within the meaning of Section 13(d)(3) or 14(d)(2) of the Securities Exchange Act, of more than 50% of either the then outstanding shares of the Company’s Common Stock or the combined voting power of the Company’s then outstanding voting securities entitled to vote generally in the election of directors (hereinafter referred to as the ownership of a “Controlling Interest”) excluding, for this purpose, any acquisitions by (1)(I) the Company or a Related Entity, (2)an affiliate, (II) any person, entity or “group” that as of the date on which the Awardaward is granted
owns beneficial ownership (within the meaning of Rule13d-3 promulgated under the Securities Exchange Act) of a Controlling Interest or (3)(III) any employee benefit plan of the Company or an affiliate. (v) “Code” means the U.S. Internal Revenue Code of 1986, as amended and in effect from time to time, or any successor thereto, together with rules, regulations, and interpretations promulgated thereunder. (vi) “Committee” means the Compensation Committee of the Board or such other committee or subcommittee of the Board, if any, duly appointed to administer the Plan and having such powers in each instance as shall be specified by the Board. If, at any time, there is no committee of the Board then authorized or properly constituted to administer the Plan, the Board shall exercise all of the powers of the Committee granted herein, and, in any event, the Board may in its discretion exercise any or all of such powers. (vii) “Company” means Synaptics Incorporated, a Related Entity.Delaware corporation, or any successor corporation thereto. (viii) “Compensation” means, with respect to any Offering Period, base wages or salary, overtime, shift differentials, payments for paid time off, and payments in lieu of notice. Compensation shall be limited to amounts actually payable in cash during the Offering Period. Except as otherwise determined by the Committee, Compensation shall not include moving allowances, automobile allowances, payments pursuant to a severance agreement, termination pay, relocation payments, bonuses, commissions, finder’s fee, compensation deferred under any program or plan, including, without limitation, pursuant to Section 401(k) or Section 125 of the Code, any amounts directly or indirectly paid pursuant to the Plan or any other stock purchase, stock option or other stock-based compensation plan, amounts paid to a pension plan or fringe benefit program by the Company or a Participating Company, or any other extraordinary compensation not included above. (ix) “Eligible Employee” means an Employee who meets the eligibility requirements set forth in Section 5 of the Plan. (x) “Employee” means a person treated as an employee of a Participating Company for purposes of Section 423. A Participant shall be deemed to have ceased to be an Employee either upon an actual termination of employment or upon the corporation employing the Participant ceasing to be a Participating Company. For purposes of the Plan, an individual shall not be deemed to have ceased to be an Employee while on any military leave, sick leave, or other bona fide leave of absence approved by the Company. (xi) “Exchange Act” means the Securities Exchange Act of 1934, as amended and in effect from time to time, or any successor thereto, together with rules, regulations, and interpretations promulgated thereunder. (xii) “Fair Market Value” means, as of any date: (A) If, on such date, the Stock is listed or quoted on a national or regional securities exchange or quotation system (including the Nasdaq Global Market), the Fair Market Value of a share of Stock shall be the closing price per share of Stock for the last preceding date as reported for such day by the principal exchange or trading market on which Stock is traded (as reported in The Wall Street Journal or such other source as the Company deems reliable) or, if Stock was not traded on such date, on the immediately preceding day on which Stock was traded; (B) If, on such date, the Stock is not then listed on a national or regional securities exchange or quotation system, the Fair Market Value of a share of Stock shall be the average of the bid and asked prices per share of Stock for such day (as determined by the Committee), or, if Stock was not traded on such date, on the immediately preceding day on which Stock was traded; or (C) If, on such date, the Stock cannot be valued pursuant to either clause (A) or (B), the Fair Market Value of a share of Stock shall be determined in good faith by the Committee, consistent with applicable legal requirements (including, if applicable, the requirements of Section 409A of the Code). (xiii) “Non-United States Offering” means a separate Offering covering Eligible Employees of one or more Participating Companies, as described in Sections 3(c), 3(d), and 11(a)(ii). (xiv) “Offering” means an offering of Stock pursuant to the Plan, as provided in Section 6. More than one Offering may run concurrently, the terms of which need not be the same, as permitted under Section 423. (xv) “Offering Date” means, for any Offering Period, the first day of such Offering Period. (xvi) “Offering Period” means a period established by the Committee during which an Offering is outstanding and which, subject to adjustment as provided in Section 6, is the period beginning on March 16 or September 16, as applicable, immediately following the end of the previous Offering Period and ending on March 15 or September 15, as applicable, which is 12 months thereafter. (xvii) “Officer” means any person designated by the Board as an officer of the Company. (xviii) “Parent” means any present or future “parent corporation” of the Company, as defined in Section 424(e) of the Code. (xix) “Participant” means an Eligible Employee who has become a participant in an Offering Period in accordance with Section 7 and remains a participant in accordance with the Plan. (xx) “Participating Company” means the Company and any Parent or Subsidiary designated by the Committee as a corporation the Employees of which may, if Eligible Employees, participate in the Plan. The Committee shall have full and final authority,the discretion to determine from time to time which Parents or Subsidiaries shall be exercisedParticipating Companies. (xxi) “Participating Company Group” means, at any point in time, the Company and all other corporations collectively which are then Participating Companies. (xxii) “Purchase Date” means, for any Offering Period, the last day of such Offering Period, or, if so determined by the Committee, the last day of each Purchase Period occurring within such Offering Period. (xxiii) “Purchase Period” means a period, established by the Committee in accordance with Section 6, included within an Offering Period and on the final date of which outstanding Purchase Rights are exercised. (xxiv) “Purchase Price” means the price at which a share of Stock may be purchased under the Plan, as determined in accordance with Section 9. (xxv) “Purchase Right” means an option granted to a Participant pursuant to the Plan to purchase such shares of Stock as provided in Section 8, which the Participant may or may not exercise during the Offering Period in which such option is outstanding. Such option arises from the right of a Participant to withdraw any payroll deductions or other funds accumulated on behalf of the Participant and not previously applied to the purchase of Stock under the Plan, and to terminate participation in the Plan at any time during an Offering Period. (xxvi) “Securities Act” means the U.S. Securities Act of 1933, as amended. (xxvii) “Stock” means the common stock, par value $0.001 per share, of the Company, as adjusted from time to time in accordance with Section 4(b). (xxviii) “Subscription Agreement” means a written or electronic agreement, in such form as is specified by the Company, stating an Employee’s election to participate in the Plan and authorizing payroll deductions under the Plan from the Employee’s Compensation or other method of payment authorized by the Committee pursuant to Section 11(a)(ii). (xxix) “Subscription Date” means the last Business Day prior to the Offering Date of an Offering Period or such earlier date as the Company shall establish. (xxx) “Subsidiary” means any present or future “subsidiary corporation” of the Company, as defined in Section 424(f) of the Code. (b) Construction. Captions and titles contained herein are for convenience only and shall not affect the meaning or interpretation of any provision of the Plan. Except when otherwise indicated by the context, the singular shall include the plural and the plural shall include the singular. Use of the term “or” is not intended to be exclusive, unless the context clearly requires otherwise. 3. Administration. (a) Administration by the Committee. The Plan shall be administered by the Committee. All questions of interpretation of the Plan, of any form of agreement or other document employed by the Company in the administration of the Plan, or of any Purchase Right shall be determined by the Committee, and such determinations shall be final, binding and conclusive upon all persons having an interest in the Plan or the Purchase Right, unless fraudulent or made in bad faith. Subject to the provisions of the Plan, the Committee shall determine all of the relevant terms and conditions of Purchase Rights; provided, however, that all Participants granted Purchase Rights pursuant to an Offering shall have the same rights and privileges within the meaning of Section 423(b)(5) of the Code. Any and all actions, decisions and determinations taken or made by the Committee in the exercise of its discretion pursuant to the Plan or any agreement thereunder (other than determining questions of interpretation pursuant to the second sentence of this Section 3(a)) shall be final, binding and conclusive upon all persons having an interest therein. All expenses reasonably incurred by the Company in the administration of the Plan shall be paid by the Company. (b) Authority of Officers. Any Officer shall have the authority to act on behalf of the Company with respect to any matter, right, obligation, determination or election that is the responsibility of or that is allocated to the Company herein, provided that the Officer has actual authority with respect to such matter, right, obligation, determination or election. (c) Power to AdoptSub-Plans or Varying Terms with Respect toNon-U.S. Employees. The Committee shall have the power, in its discretion, to adopt one or moresub-plans of the Plan as the Committee deems necessary or desirable to comply with the laws or regulations, tax policy, accounting principles or custom of foreign jurisdictions applicable to employees of a subsidiary business entity of the Company, provided that any suchsub-plan shall not be within the scope of an “employee stock purchase plan” within the meaning of Section 423. Except as superseded by the provisions of asub-plan, the provisions of this Plan shall govern suchsub-plan. Alternatively and in order to comply with the laws of a foreign jurisdiction, the Committee shall have the power, in its discretion, to grant Purchase Rights in an Offering to citizens or residents of anon-U.S. jurisdiction (without regard to whether they are also citizens of the United States or resident aliens) that provide terms which are less favorable than or different from the terms of Purchase Rights granted under the same Offering to Employees resident in the United States. (d) Power to Establish Separate Offerings with Varying Terms. The Committee shall have the power, in its discretion, to establish separate, simultaneous or overlapping Offerings having different terms and conditions and to designate the Participating Company or Companies that may participate in a particular Offering, provided that each Offering shall individually comply with the terms of the Plan and the requirements of Section 423(b)(5) of the Code that all Participants granted Purchase Rights pursuant to such Offering shall have the same rights and privileges within the meaning of such section. (e) Policies and Procedures Established by the Company. Without regard to whether any Participant’s Purchase Right may be considered adversely affected, the Company may, from time to time, consistent with the Plan and the requirements of Section 423, establish, change or terminate such rules, guidelines, policies, procedures, limitations, or adjustments as deemed advisable by the Company, in its discretion, for the proper administration of the Plan, including, without limitation, (i) a minimum payroll deduction amount required for participation in an Offering, (ii) a limitation on the frequency or number of changes permitted in the rate of payroll deduction during an Offering, (iii) an exchange ratio applicable to amounts withheld or paid in a currency other than United States dollars, (iv) a payroll deduction greater than or less than the amount designated by a Participant in order to adjust for the Company’s delay or mistake in processing a Subscription Agreement or in otherwise effecting a Participant’s election under the Plan or as advisable to comply with the requirements of Section 423, and (v) determination of the date and manner by which the Fair Market Value of a share of Stock is determined for purposes of administration of the Plan. All such actions by the Company shall be taken consistent with the requirements under Section 423(b)(5) of the Code that all Participants granted Purchase Rights pursuant to an Offering shall have the same rights and privileges within the meaning of such section, except as otherwise permitted by Section 3(c) and the regulations under Section 423. (f) Indemnification. In addition to such other rights of indemnification as they may have as members of the Board or the Committee or as officers or employees of the Participating Company Group, to the extent permitted by applicable law, members of the Board or the Committee and any officers or employees of the Participating Company Group to whom authority to act for the Board, the Committee or the Company is delegated shall be indemnified by the Company against all reasonable expenses, including attorneys’ fees, actually and necessarily incurred in connection with the defense of any action, suit or proceeding, or in connection with any appeal therein, to which they or any of them may be a party by reason of any action taken or failure to act under or in connection with the Plan, or any right granted hereunder, and against all amounts paid by them in settlement thereof (provided such settlement is approved by independent legal counsel selected by the Company) or paid by them in satisfaction of a judgment in any such action, suit or proceeding, except in relation to matters as to which it shall be adjudged in such action, suit or proceeding that such person is liable for gross negligence, bad faith or intentional misconduct in duties; provided, however, that within sixty (60) days after the institution of such action, suit or proceeding, such person shall offer to the Company, in writing, the opportunity at its own expense to handle and defend the same. 4. Shares Subject to Plan. (a) Maximum Number of Shares Issuable. Subject to adjustment as provided in Section 4(b), the maximum aggregate number of shares of Stock that may be issued under the Plan shall be 1,500,000 and shall consist of authorized but unissued or reacquired shares of Stock, shares of Stock purchased on the open market, or any combination thereof. If an outstanding Purchase Right for any reason expires or is terminated or canceled, the shares of Stock allocable to the unexercised portion of that Purchase Right shall again be available for issuance under the Plan. (b) Adjustments for Changes in Capital Structure. Subject to any required action by the stockholders of the Company and the requirements of Section 424 of the Code to the extent applicable, in the event of any change in the Stock effected without receipt of consideration by the Company, whether through merger, consolidation, reorganization, reincorporation, recapitalization, reclassification, stock dividend, stock split, reverse stock split,split-up,split-off,spin-off, combination of shares, exchange of shares, or similar change in the capital structure of the Company, or in the event of payment of a dividend or distribution to the stockholders of the Company in a form other than Stock (excepting regular, periodic cash dividends) that has a material effect on the Fair Market Value of shares of Stock, appropriate and proportionate adjustments shall be made in the number and kind of shares subject to the Plan, the limit on the shares which may be purchased by any Participant during an Offering (as described in Sections 8(a) and 8(b)) and each Purchase Right, and in the Purchase Price in order to prevent dilution or enlargement of Participants’ rights under the Plan. For purposes of the foregoing, conversion of any convertible securities of the Company shall not be treated as “effected without receipt of consideration by the Company.” If a majority of the shares which are of the same class as the shares that are subject to outstanding Purchase Rights are exchanged for, converted into, or otherwise become (whether or not pursuant to a Change in Control) shares of another corporation (the“New Shares”), the Committee may unilaterally amend the outstanding Purchase Rights to provide that such Purchase Rights are for New Shares. In the event of any such amendment, the number of shares subject to, and the exercise price per share of, the outstanding Purchase Rights shall be adjusted in a fair and equitable manner as determined by the Committee, in its discretion. Any fractional share resulting from an adjustment pursuant to this Section shall be rounded down to the nearest whole number, and in no event may the Purchase Price be decreased to an amount less than the par value, if any, of the stock subject to the Purchase Right. The adjustments determined by the Committee pursuant to this Section 4(b) shall be final, binding and conclusive. 5. Eligibility. (a) Employees Eligible to Participate.Each Employee of a Participating Company is eligible to participate in the Plan and shall be deemed an Eligible Employee, except the following: (i) Any Employee who has been employed by the Participating Company Group for a period of less than one monthas of the first day of an Offering Period; (ii) Any Employee who is customarily employed by the Participating Company Group for twenty (20) hours or less per week; or (iii) Any Employee who is customarily employed by the Participating Company Group for not more than five (5) months in any calendar year. (b) Exclusion of Certain Stockholders. Notwithstanding any provision of the Plan to the contrary, no Employee shall be treated as an Eligible Employee and granted a Purchase Right under the Plan if, immediately after such grant, the Employee would own, or hold options to purchase, stock of the Company or of any Parent or Subsidiary possessing five percent (5%) or more of the total combined voting power or value of all classes of stock of such corporation, as determined in accordance with Section 423(b)(3) of the Code. For purposes of this Section 5(b), the attribution rules of Section 424(d) of the Code shall apply in determining the stock ownership of such Employee. (c) Determination by Company. The Company shall determine conclusivelyin good faith and in the exercise of its discretion whether an individual has become or has ceased to be an Employee or an Eligible Employee and the effective date of such individual’s attainment or termination of such status, as the case may be. For purposes of an individual’s participation in or other rights, if any, under the Plan as of the time of the Company’s determination of whether or not the individual is an Employee, all such determinations by the Company shall be final, binding and conclusive as to such rights, if any, notwithstanding that the Company or any court of law or governmental agency subsequently makes a contrary determination as to such individual’s status as an Employee. In addition, the Administrator may, for Offering Periods that have not yet commenced, establish additional eligibility requirements not inconsistent with Section 423. 6. Offerings. The Plan shall be implemented by sequential Offerings of approximately twelve (12) months duration or such other duration as the Committee shall determine. Offering Periods shall commence and end on dates determined by the Administrator. Notwithstanding the foregoing, the Committee may establish additional or alternative concurrent, sequential or overlapping Offering Periods, a different duration for one or more Offering Periods or different commencing or ending dates for such Offering Periods;provided,however, that no Offering Period may have a duration exceeding twenty-seven (27) months. If the Committee shall so determine in its discretion, each Offering Period may consist of two (2) or more consecutive Purchase Periods having such duration as the Committee shall specify, and the last day of each such Purchase Period shall be a Purchase Date. If the first or last day of an Offering Period or a Purchase Period is not a Business Day, the Company shall specify the Business Day that will be deemed the first or last day, as the case may be, of the Offering Period or Purchase Period. A new Offering Period shall commence, and the old Offering Period shall terminate, on the first Business Day after a Purchase Date (other than the last Purchase Date of an Offering Period) if the Fair Market Value of a share of Stock is less than the Fair Market Value of a share of Stock on the Offering Date of the Offering Period. 7. Participation in the Plan. (a) Initial Participation. An Eligible Employee may become a Participant in an Offering Period by delivering a properly completed written or electronic Subscription Agreement to the Company office or representative designated by the Company (including the Administrator) not later than the close of business on the date established by the Company for that Offering Period. An Eligible Employee who does not deliver a properly completed Subscription Agreement in the manner permitted or required on or before the Subscription Date for an Offering Period shall not participate in the Plan for that Offering Period or for any subsequent Offering Period unless the Eligible Employee subsequently delivers a properly completed Subscription Agreement to the appropriate Company office or representative on or before the Subscription Date for such subsequent Offering Period. An Employee who becomes an Eligible Employee after the Offering Date of an Offering Period shall not be eligible to participate in that Offering Period but may participate in any subsequent Offering Period provided the Employee is still an Eligible Employee as of the Offering Date of such subsequent Offering Period. (b) Continued Participation.A Participant shall automatically participate in the next Offering Period commencing immediately after the final Purchase Date of each Offering Period in which the Participant participates provided that the Participant remains an Eligible Employee on the Offering Date of the new Offering Period and has not either (i) withdrawn from the Plan pursuant to Section 12(a), or (ii) terminated employment or otherwise ceased to be an Eligible Employee as provided in Section 13. A Participant who may automatically participate in a subsequent Offering Period, as provided in this Section, is not required to deliver any additional Subscription Agreement for the subsequent Offering Period in order to continue participation in the Plan. However, a Participant may deliver a new Subscription Agreement for a subsequent Offering Period in accordance with the procedures set forth in Section 7(a) if the Participant desires to change any of the elections contained in the Participant’s then effective Subscription Agreement. 8. Right to Purchase Shares. (a) Grant of Purchase Right. Except as otherwise provided below, on the Offering Date of each Offering Period, each Participant in such Offering Period shall be granted automatically a Purchase Right consisting of an option to purchase the lesser of (i) that number of whole shares of Stock determined by dividing the Dollar Limit (to the extent provided by the Committee) by the Fair Market Value of a share of Stock on such Offering Date or (ii) the Share Limit (determined as provided below). The Committee may, in its discretion and prior to the Offering Date of any Offering Period, (A) change the method of, or any of the foregoing factors in, determining the number of shares of Stock subject to Purchase Rights to be granted on such Offering Date, or (B) specify a maximum aggregate number of shares that may be purchased by all Participants in an Offering or on any Purchase Date within an Offering Period. No Purchase Right shall be granted on an Offering Date to any person who is not, on such Offering Date, an Eligible Employee. For the purposes of this Section, the“Share Limit” shall be 650 shares of Stock per 6 month Purchase Period. The Share Limit may be adjusted by the Committee prior to the start of an Offering Period. (b) Calendar Year Purchase Limitation. Notwithstanding any provision of the Plan to the contrary, no Participant shall be granted a Purchase Right which permits his or her right to purchase shares of Stock under the Plan to accrue at a rate which, when aggregated with such Participant’s rights to purchase shares under all other employee stock purchase plans of a Participating Company intended to meet the requirements of Section 423, exceeds $25,000 in Fair Market Value (or such other limit, if any, as may be imposed by the Code) for each calendar year in which such Purchase Right is outstanding at any time. For purposes of the preceding sentence, the Fair Market Value of shares purchased during a given Offering Period shall be determined as of the Offering Date for such Offering Period. The limitation described in this Section shall be applied in conformance with Section 423(b)(8) of the Code and the regulations thereunder. 9. Purchase Price. The Purchase Price at which each share of Stock may be acquired in an Offering Period upon the exercise of all or any portion of a Purchase Right shall be established by the Committee;provided,however, that the Purchase Price on each Purchase Date shall not be less thaneighty-five percent (85%) of the lesser of (a) the Fair Market Value of a share of Stock on the Offering Date of the Offering Period or (b) the Fair Market Value of a share of Stock on the Purchase Date. 10. Accumulation of Purchase Price through Payroll Deduction. Except as provided in Section 11(a)(ii) with respect to aNon-United States Offering, shares of Stock acquired pursuant to the exercise of all or any portion of a Purchase Right may be paid for only by means of payroll deductions from the Participant’s Compensation accumulated for the Offering Period for which such Purchase Right was granted, subject to the following: (a) Amount of Payroll Deductions. Except as otherwise provided herein, the amount to be deducted under the Plan from a Participant’s Compensation on each pay day shall be determined by the Participant’s Subscription Agreement in accordance with procedures established by the Administrator. ForNon-United States Offerings, a Participant’s payroll deduction from his or her Compensation will be in the applicable local currency and will be converted into United States dollars based upon the exchange rate as determined by the Company consistent with its accounting practices on the Purchase Date. The Subscription Agreement shall set forth the percentage or dollar amount of the Participant’s Compensation to be deducted on anafter-tax basis on each pay day in whole percentages or dollars equivalent to not less than one percent (1%) (except as a result of an election pursuant to Section 10(c) to stop payroll deductions effective following the first pay day during an Offering) or more than fifteen percent (15%). Notwithstanding the foregoing, a Participant’s payroll deductions for each calendar year may not exceed the limitations in Section 8. The Committee may change the foregoing limits on payroll deductions effective as of any Offering Date. Participants may change the payroll deduction election one time during a Purchase Period, unless otherwise determined by the Committee. (b) Commencement of Payroll Deductions. Payroll deductions shall commence on the first applicable pay day for the Offering Period and shall continue to the end of the Offering Period unless sooner cancelled or terminated as provided herein. (c) Election Stop Payroll Deductions. During an Offering Period, a Participant may elect to stop deductions from his or her Compensation by delivering to the Company office or representative designated by the Company (including the Administrator) a cancellation notice in accordance with the procedures prescribed by, and in a form acceptable to, the Company. To be effective with respect to an upcoming Purchase Date, such cancellation notice must be delivered not later than ten (10) Business Days prior to such Purchase Date. Upon such cancellation, the balance in the Participant’s Plan account will be returned to the Participant, without interest, as soon as administratively practicable thereafter. (d) Administrative Suspension of Payroll Deductions. The Company may, in its discretion, suspend a Participant’s payroll deductions under the Plan as the Company deems advisable to avoid accumulating payroll deductions in excess of the amount that could reasonably be anticipated to purchase the maximum number of shares of Stock permitted (i) under the Participant’s Purchase Right, or (ii) during a calendar year under the limit set forth in Section 8(b). Unless the Participant has either withdrawn from the Plan as provided in Section 12(a) or has ceased to be an Eligible Employee, suspended payroll deductions shall be resumed at the rate specified in the Participant’s then effective Subscription Agreement either (A) at the beginning of the next Offering Period if the reason for suspension was clause (i) in the preceding sentence, or (B) at the beginning of the next Offering Period having a first Purchase Date that falls within the subsequent calendar year if the reason for suspension was clause (ii) in the preceding sentence. (e) Participant Accounts. Individual bookkeeping accounts shall be maintained for each Participant. All payroll deductions from a Participant’s Compensation (and other amounts received from anon-United States Participant pursuant to Section 11(a)(ii)) shall be credited to such Participant’s Plan account and shall be deposited with the general funds of the Company unless otherwise required by applicable law. All such amounts received or held by the Company may be used by the Company for any corporate purpose. (f) No Interest Paid. Interest shall not be paid on sums deducted from a Participant’s Compensation pursuant to the Plan or otherwise credited to the Participant’s Plan account unless otherwise required by applicable law. 11. Purchase of Shares. (a) Exercise of Purchase Right. (i) Generally. Except as provided in Section 11(a)(ii), on each Purchase Date of an Offering Period, each Participant who has not withdrawn from the Plan and whose participation in the Offering has not otherwise terminated before such Purchase Date shall automatically acquire pursuant to the exercise of the Participant’s Purchase Right the number of whole shares of Stock determined by dividing (a) the total amount of the Participant’s payroll deductions accumulated in the Participant’s Plan account for the Offering Period and not previously applied toward the purchase of Stock by (b) the Purchase Price. However, in no event shall the number of shares purchased by the Participant during an Offering Period exceed the number of shares subject to the Participant’s Purchase Right. No shares of Stock shall be purchased on a Purchase Date on behalf of a Participant whose participation in the Offering or the Plan has terminated before such Purchase Date. (ii) Purchase byNon-United States Participants for Whom Payroll Deductions Are Prohibited by Applicable Law. Notwithstanding Section 11(a)(i), where payroll deductions on behalf of Participants who are citizens or residents of countries other than the United States (without regard to whether they are also citizens of the United States or resident aliens) are prohibited by applicable law, the Committee may establish a separate Offering (a“Non-United States Offering”) covering all Eligible Employees of one or more Participating Companies subject to such prohibition on payroll deductions. TheNon-United States Offering shall provide another method for payment of the Purchase Price with such terms and conditions as shall be administratively convenient and comply with applicable law. On each Purchase Date of the Offering Period applicable to aNon-United States Offering, each Participant who has not withdrawn from the Plan and whose participation in such Offering Period has not otherwise terminated before such Purchase Date shall automatically acquire pursuant to the exercise of the Participant’s Purchase Right a number of whole shares of Stock determined in accordance with Section 11(a)(i) to the extent of the total amount of the Participant’s Plan account balance accumulated during the Offering Period in accordance with the method established by the Committee and not previously applied toward the purchase of Stock. However, in no event shall the number of shares purchased by a Participant during such Offering Period exceed the number of shares subject to the Participant’s Purchase Right. The Company shall refund to a Participant in aNon-United States Offering in accordance with Section 11(d) any excess Purchase Price payment received from such Participant. (b) Pro Rata Allocation of Shares. If the number of shares of Stock which might be purchased by all Participants on a Purchase Date exceeds the number of shares of Stock available in the Plan as provided in Section 4(a) or the maximum aggregate number of shares of Stock that may be purchased on such Purchase Date pursuant to a limit established by the Committee pursuant to Section 8(a), the Company shall make a pro rata allocation of the shares available in as uniform a manner as practicable and as the Company determines to be equitable. Any fractional share resulting from such pro rata allocation to any Participant shall be disregarded. (c) Delivery of Title to Shares. Subject to any governing rules or regulations, as soon as practicable after each Purchase Date, the Company shall issue or cause to be issued to or for the benefit of each Participant the shares of Stock acquired by the Participant on such Purchase Date by means of one or more of the following: (i) by delivering to the Participant evidence of book entry shares of Stock credited to the account of the Participant, (ii) by depositing such shares of Stock for the benefit of the Participant with any broker with which the Participant has an account relationship, or (iii) by delivering such shares of Stock to the Participant in certificate form. (d) Return of Plan Account Balance. Any cash balance remaining in a Participant’s Plan account following any Purchase Date shall be refunded to the Participant as soon as practicable after such Purchase Date. However, if the cash balance to be returned to a Participant pursuant to the preceding sentence is less than the amount that would have been necessary to purchase an additional whole share of Stock on such Purchase Date, the Company may retain the cash balance in the Participant’s Plan account to be applied toward the purchase of shares of Stock in the subsequent Purchase Period or Offering Period. (e) Tax Withholding. At the time a Participant’s Purchase Right is exercised, in whole or in part, or at the time a Participant disposes of some or all of the shares of Stock he or she acquires under the Plan, the Participant shall make adequate provision for the federal, state, local and foreign taxes (including social insurance), if any, required to be withheld by any Participating Company upon exercise of the Purchase Right or upon such disposition of shares, respectively. A Participating Company may, but shall not be obligated to, withhold from the Participant’s compensation the amount necessary to meet such withholding obligations. (f) Expiration of Purchase Right. Any portion of a Participant’s Purchase Right remaining unexercised after the end of the Offering Period to which the Purchase Right relates shall expire immediately upon the end of the Offering Period. (g) Provision of Reports and Stockholder Information to Participants. Each Participant who has exercised all or part of his or her Purchase Right shall receive, as soon as practicable after the Purchase Date, a report of such Participant’s Plan account setting forth the total amount credited to his or her Plan account prior to such exercise, the number of shares of Stock purchased, the Purchase Price for such shares, the date of purchase and the cash balance, if any, remaining immediately after such purchase that is to be refunded or retained in the Participant’s Plan account pursuant to Section 11(d). The report required by this Section may be delivered in such form and by such means, including by electronic transmission, as the Company may determine. In addition, each Participant shall be provided information concerning the Company equivalent to that information provided generally to the Company’s common stockholders. 12. Withdrawal from Plan. (a) Voluntary Withdrawal from the Plan. A Participant may withdraw from the Plan by signing and delivering to the Company office or representative designated by the Company (including the Administrator) a written or electronic notice of withdrawal on a form provided by the Company for this purpose. Such withdrawal may be elected at any time prior to the end of an Offering Period; provided, however, that if a Participant withdraws from the Plan after a Purchase Date, the withdrawal shall not affect shares of Stock acquired by the Participant on such Purchase Date. A Participant who voluntarily withdraws from the Plan is prohibited from resuming participation in the Plan in the same Offering from which he or she withdrew, but may participate in any subsequent Offering by again satisfying the requirements of Sections 5 and 7(a). The Company may impose, from time to time, a requirement that the notice of withdrawal from the Plan be on file with the Company office or representative designated by the Company for a reasonable period prior to the effectiveness of the Participant’s withdrawal. (b) Return of Plan Account Balance. Upon a Participant’s voluntary withdrawal from the Plan pursuant to Section 12(a), the Participant’s accumulated Plan account balance which has not been applied toward the purchase of shares of Stock shall be refunded to the Participant as soon as practicable after the withdrawal, without the payment of any interest (unless otherwise required by applicable law), and the Participant’s interest in the Plan and the Offering shall terminate. Such amounts to be refunded in accordance with this Section may not be applied to any other Offering under the Plan. 13. Termination of Employment or Eligibility. Upon a Participant’s ceasing, prior to a Purchase Date, to be an Employee of the Participating Company Group for any reason, including retirement, disability or death, or upon the failure of a Participant to remain an Eligible Employee, the Participant’s participation in the Plan shall terminate immediately. In such event, the Participant’s Plan account balance which has not been applied toward the purchase of shares of Stock shall, as soon as practicable, be returned to the Participant or, in the case of the Participant’s death, to the Participant’s beneficiary designated in accordance with Section 20, if any, or legal representative, and all of the Participant’s rights under the Plan shall terminate. Interest shall not be paid on sums returned pursuant to this Section 13 unless otherwise required by applicable law. A Participant whose participation has been so terminated may again become eligible to participate in the Plan by satisfying the requirements of Sections 5 and 7(a). 14. Effect of Change in Control on Purchase Rights. In the event of a Change in Control, has occurred pursuant to the above definition, andBoard (or the Committee) may, provide for any of, or a combination of any of, the following: (a) each Purchase Right shall be assumed or an equivalent purchase right shall be substituted by the successor entity or parent or subsidiary of such successor entity, (b) a date selected by the Board (or the Committee) on or before the date of the occurrenceconsummation of such Change in Control shall be treated as a Purchase Date and any incidental matters relating thereto. If required for compliance with Section 409A ofall outstanding Purchase Rights shall be exercised on such date, (c) all outstanding Purchase Rights shall terminate and the Code, in no eventaccumulated payroll deductions will abe refunded to each Participant upon or immediately prior to the Change in Control, or (d) outstanding Purchase Rights shall continue unchanged. 15. Nontransferability of Purchase Rights. Neither payroll deductions or other amounts credited to a Participant’s Plan account nor a Participant’s Purchase Right may be deemed to have occurred if such transaction is not also a “changeassigned, transferred, pledged or otherwise disposed of in the ownership or effective control of” the Company or “a change in the ownership of a substantial portion of the assets of” the Companyany manner other than as determined under Treasury Regulation Section 1.409A-3(i)(5) (without regard to any alternative definition thereunder). 10.General Provisions.
(a)Compliance With Legal and Other Requirements. The Company may, to the extent deemed necessary or advisableprovided by the Committee, postpone the issuancePlan or delivery of Stock or payment of other benefits under any Award until completion of such registration or qualification of such Stock or other required action under any federal or state law, rule or regulation, listing or other required action with respect to any stock exchange or automated quotation system upon which the Stock or other Company securities are listed or quoted, or compliance with any other obligation of the Company, as the Committee, may consider appropriate, and may require any Participant to make such representations, furnish such information and comply with or be subject to such other conditions as it may consider appropriate in connection with the issuance or delivery of Stock or payment of other benefits in compliance with applicable laws, rules, and regulations, listing requirements, or other obligations. The foregoing notwithstanding, in connection with a Change in Control, the Company shall take or cause to be taken no action, and shall undertake or permit to arise no legal or contractual obligation, that results or would result in any postponement of the issuance or delivery of Stock or payment of benefits under any Award or the imposition of any other conditions on such issuance, delivery or payment, to the extent that such postponement or other condition would represent a greater burden on a Participant than existed on the 90th day preceding the Change in Control.
(b)Limits on Transferability; Beneficiaries.
(i)General. Except as provided herein, a Participant may not assign, sell, transfer, or otherwise encumber or subject to any lien any Award or other right or interest granted under this Plan, in whole or in part, including any Award or right which constitutes a derivative security as generally defined in Rule 16a-1(c) under the Exchange Act, other than by will or by operation of the laws of descent and distribution, anddistribution. (A beneficiary designation pursuant to Section 20 shall not be treated as a disposition for this purpose.) Any such Awardsattempted assignment, transfer, pledge or rights that may be exercisableother disposition shall be exercisedwithout effect, except that the Company may treat such act as an election to withdraw from the Plan as provided in Section 12(a). A Purchase Right shall be exercisable during the lifetime of the Participant only by the Participant or his or her guardian or legal representative.Participant.
(ii)16. Permitted Transfer of OptionCompliance with Securities Law..
The Committee, in its sole discretion, may permit the transfer of an Option (but not an Incentive Stock Option, or any other right to purchase Stock other than an Option) as follows: (A) by gift to a member of the Participant’s Immediate Family or (B) by transfer by instrument to a trust providing that the Option is to be passed to beneficiaries upon death of the Optionee. For purposes of this Section 10(b)(ii), “Immediate Family” shall mean the Optionee’s spouse (including a former spouse subject to terms of a domestic relations order); child, stepchild, grandchild, child-in-law; parent, stepparent, grandparent, parent-in-law; sibling and sibling-in-law, and shall include adoptive relationships. If a determination is made by counsel for the Company that the restrictions contained in this Section 10(b)(ii) are not required by applicable federal or state securities laws under the circumstances, then the Committee, in its sole discretion, may permit the transfer of Awards (other than Incentive Stock Options and Stock Appreciation Rights in tandem therewith) to one or more Beneficiaries or other transferees during the lifetime of the Participant, which may be exercised by such transferees in accordance with the terms of such Award, but only if and to the extent permitted by the Committee pursuant to the express terms of an Award agreement (subject to any terms and conditions which the Committee may impose thereon, and further subject to any prohibitions and restrictions on such transfers pursuant to Rule 16b-3). A Beneficiary, transferee, or other person claiming any rights under the Plan from or through any Participant shall be subject to all terms and conditions of the Plan and any Award agreement applicable to such Participant, except as otherwise determined by the Committee, and to any additional terms and conditions deemed necessary or appropriate by the Committee. (c) Adjustments.
(i)Adjustments to Awards. In the event that any dividend or other distribution (whether in the form of cash, Stock, or other property), recapitalization, forward or reverse split, reorganization, merger, consolidation, spinoff, combination, repurchase, share exchange, liquidation, dissolution or other similar corporate transaction or event affects the Stock and/or such other securities of the Company or any other issuer such that a substitution, exchange, or adjustment is determined by the Committee to be appropriate, then the Committee shall, in such manner as it deems equitable, substitute, exchange, or adjust any or all of (A) the number and kindissuance of shares of Stock which may be delivered in connection with Awards granted thereafter, (B) the number and kind of shares of Stock by which Plan limitations are measured (including but not limited to limitations established for purposes of Code Sections 162(m) and 421 as well as per Person award limits), (C) the number and kind of shares of Stock subject to or deliverable in respect of outstanding Awards, (E) the exercise price, grant price or purchase price relating to any Award and/or “make provision for payment of cash or other property” in respect of any outstanding Award, and (F) any other aspect of any Award that the Committee determines to be appropriate.
(ii)Adjustments in Case of a Change in Control. In the event of a Change in Control in which the Company is not the surviving corporation, or in which the shares of Stock are exchanged for or converted into securities issued by another entity, then the successor or acquiring entity or an affiliate thereof may, with the consent of the
Committee, assume each outstanding Award or substitute an equivalent option or right. If the successor or acquiring entity or an affiliate thereof, does not cause such an assumption or substitution, then each Award shall terminate upon the consummation of such Change in Control. The Committee shall give written notice of any proposed transaction referred to in this Section 10(c)(ii) a reasonable period of time prior to the closing date for such transaction (which notice may be given either before or after the approval of such transaction), in order that Optionees may have a reasonable period of time prior to the closing date of such transaction within which to exercise any Options that are then exercisable (including any Options that may become exercisable upon the closing date of such transaction). An Optionee may condition his exercise of any Option upon the consummation of the transaction.
(iii)Other Adjustments. In addition, the Committee is authorized to make adjustments in the terms and conditions of, and the criteria included in, Awards (including Performance Awards and performance goals, and Annual Incentive Awards and any Annual Incentive Award pool or performance goals relating thereto) in recognition of unusual or nonrecurring events (including, without limitation, acquisitions and dispositions of businesses and assets) affecting the Company, any Related Entity or any business unit, or the financial statements of the Company or any Related Entity, or in response to changes in applicable laws, regulations, accounting principles, tax rates and regulations or business conditions or in view of the Committee’s assessment of the business strategy of the Company, any Related Entity or business unit thereof, performance of comparable organizations, economic and business conditions, and any other circumstances deemed relevant; provided that without the consent of an affected Participant, no such Board action may materially and adversely affect the rights of such Participant under any previously granted and outstanding Award. In addition, no such adjustment shall be authorized or made if and to the extent that such authority or the making of such adjustment would cause Options, Stock Appreciation Rights, Performance Awards granted under Section 8(b) hereof or Annual Incentive Awards granted under Section 8(c) hereof to Participants designated by the Committee as Covered Employees and intended to qualify as “performance-based compensation” under Code Section 162(m) and the regulations thereunder to otherwise fail to qualify as “performance-based compensation” under Code Section 162(m) and regulations thereunder.
(d)Clawback/Recovery. All Awards (cash and equity) held by the Company’s Executive Officers shall be subject to clawback, recoupment or forfeiture (i) to the extent that such Executive Officer is determined to have engaged in fraud or intentional illegal conduct that caused the Company’s material non-compliance with any applicable financial reporting requirements and resulted in a financial restatement, the result of which is that the amount received from such Award would have been lower had it been calculated on the basis of such restated results, or (ii) required by applicable laws, rules, regulations or listing requirements. Such clawback, recoupment or forfeiture, in addition to any other remedies available under applicable laws, rules, regulations or listing requirements, shall occur through the cancellation of such Awards (to the extent then-outstanding), the recoupment of any gains realized with respect to such Awards, or a combination of the foregoing, to the extent of the overpayment. The implementation of any clawback policy will not be deemed a triggering event for purposes of any definition of “good reason” for resignation or any “constructive termination.”
(e)Taxes. The Company and any Related Entity are authorized to withhold from any Award granted, any payment relating to an Award under the Plan, including from a distribution of Stock, or any payroll or other payment to a Participant, amounts of withholding and other taxes due or potentially payable in connection with any transaction involving an Award, and to take such other action as the Committee may deem advisable to enable the Company and Participants to satisfy obligations for the payment of withholding taxes and other tax obligations relating to any Award. This authority shall include authority to withhold or receive Stock or other property and to make cash payments in respect thereof in satisfaction of a Participant’s tax obligations; either on a mandatory or elective basis in the discretion of the Committee.
(f)Changes to the Plan and Awards. The Board may amend, alter, suspend, discontinue or terminate the Plan, or the Committee’s authority to grant Awards under the Plan, without the consent of stockholders or Participants, except that any amendment or alteration to the Plan shall be subject to compliance with all applicable requirements of federal, state and foreign law with respect to such securities. A Purchase Right may not be exercised if the approvalissuance of the Company’s stockholders not later than the annual meeting next followingshares upon such Board action if (i) such stockholder approval is required byexercise would constitute a violation of any applicable federal, state or stateforeign securities laws or other law or regulation (including, without limitation, Rule 16b-3 or Code Section 162(m))regulations or the rulesrequirements of any stocksecurities exchange or automated quotationmarket system onupon which the Stock may then be listed or quoted, or (ii) the amendment or alternation to the Plan materially increases the benefits accruing to the participantslisted. In addition, no Purchase Right may be exercised unless (a) a registration statement under the Plan, materially increasesSecurities Act shall at the numbertime of securities that may be issued under the Plan, or materially modifies the requirements for participant in the Plan, and the Board may otherwise, in its discretion, determine to submit other such changes to the Plan to stockholders for approval; provided that, without the consent of an affected Participant, no such Board action may materially and adversely affect the rights of such Participant under any previously granted and outstanding Award. The Committee may waive any conditions or rights under, or amend, alter, suspend, discontinue or terminate any Award theretofore granted and any Award agreement relating thereto, except as otherwise provided in the Plan; provided that, without the consent of an affected Participant, no such Committee action may materially and adversely affect the rights of such Participant under such Award.
(g)Change in Time Commitment. If a Participant’s regular level of time commitment in the performance of his or her services for the Company and anyexercise of the Related Entities is reduced (for example, and without limitation, if the Participant is an Employee of the Company and the Employee has a changePurchase Right be in status from a full-time Employee to a part-time Employee) after the date of grant of any Award to the Participant, the Committee has the right in its sole discretion (and without the need to seek or obtain the consent of the affected Participant) to (i) make a corresponding reduction in the number of shares or cash amount subject to any portion of such Award that is scheduled to vest or become payable after the date of such change in time commitment, and (ii) in lieu of or in combination with such a reduction, extend the vesting or payment schedule applicable to such Award (but in no event will such extension extend the term of an Option or Stock Appreciation Right). In the event of any such reduction, the Participant will have no righteffect with respect to any portionthe shares issuable upon exercise of the Award that is so reducedPurchase Right, or extended.
(h)Limitation on Rights Conferred Under Plan. Neither the Plan nor any action taken hereunder shall be construed as (i) giving any Eligible Person or Participant the right to continue as an Eligible Person or Participant or(b) in the employopinion of legal counsel to the Company, the shares issuable upon exercise of the Company or a Related Entity; (ii) interfering in any way with the right of the Company or a Related Entity to terminate any Eligible Person’s or Participant’s Continuous Service at any time, (iii) giving an Eligible Person or Participant any claim toPurchase Right may be granted any Award under the Plan or to be treated uniformly with other Participants and Employees, or (iv) conferring on a Participant any of the rights of a stockholder of the Company unless and until the Participant is duly issued or transferred shares of Stock in accordance with the terms of an Award.applicable exemption from the registration requirements of the Securities Act. The inability of the Company to obtain from any regulatory body having jurisdiction the authority, if any, deemed by the Company’s legal counsel to be necessary to the lawful issuance and sale of any shares under the Plan shall relieve the Company of any liability in respect of the failure to issue or sell such shares as to which such requisite authority shall not have been obtained. As a condition to the exercise of a Purchase Right, the Company may require the Participant to satisfy any qualifications that may be necessary or appropriate, to evidence compliance with any applicable law or regulation, and to make any representation or warranty with respect thereto as may be requested by the Company.
(i)17. Unfunded StatusRights as a Stockholder and Employee.
A Participant shall have no rights as a stockholder by virtue of Awards; Creation of Trusts. The Plan is intended to constitute an “unfunded” plan for incentive and deferred compensation. With respect to any payments not yet made to a Participant or obligation to deliver Stock pursuant to an Award, nothing containedthe Participant’s participation in the Plan until the date of the issuance of the shares of Stock purchased pursuant to the exercise of the Participant’s Purchase Right (as evidenced by the appropriate entry on the books of the Company or of a duly authorized transfer agent of the Company). No adjustment shall be made for dividends, distributions or other rights for which the record date is prior to the date such shares are issued, except as provided in Section 4(b). Nothing herein shall confer upon a Participant any right to continue in the employ of the Participating Company Group or interfere in any way with any right of the Participating Company Group to terminate the Participant’s employment at any time. 18. Notification of Disposition of Shares. The Company may require the Participant to give the Company prompt notice of any disposition of shares of Stock acquired by exercise of a Purchase Right. The Company may require that until such time as a Participant disposes of shares of Stock acquired upon exercise of a Purchase Right, the Participant shall hold all such shares in the Participant’s name until the later of two years after the date of grant of such Purchase Right or one year after the date of exercise of such Purchase Right. The Company may direct that the certificates evidencing shares of Stock acquired by exercise of a Purchase Right refer to such requirement to give prompt notice of disposition. 19. Legends. The Company may at any time place legends or other identifying symbols referencing any applicable federal, state or foreign securities law restrictions or any Award shall give any such Participant any rights that are greater than those of a general creditorprovision convenient in the administration of the Company; provided thatPlan on some or all of the Committee may authorize the creationcertificates representing shares of trusts and deposit therein cash, Stock other Awards or other property, or make other arrangements to meet the Company’s obligationsissued under the Plan. Such trusts or other arrangementsThe Participant shall, be consistent withat the “unfunded” statusrequest of the Company, promptly present to the Company any and all certificates representing shares acquired pursuant to a Purchase Right in the possession of the Participant in order to carry out the provisions of this Section. Unless otherwise specified by the Company, legends placed on such certificates may include, but shall not be limited to the following: “THE SHARES EVIDENCED BY THIS CERTIFICATE WERE ISSUED BY THE CORPORATION TO THE REGISTERED HOLDER UPON THE PURCHASE OF SHARES UNDER AN EMPLOYEE STOCK PURCHASE PLAN AS DEFINED IN SECTION 423 OF THE INTERNAL REVENUE CODE OF 1986, AS AMENDED. THE TRANSFER AGENT FOR THE SHARES EVIDENCED HEREBY SHALL NOTIFY THE CORPORATION IMMEDIATELY OF ANY TRANSFER OF THE SHARES BY THE REGISTERED HOLDER HEREOF. THE REGISTERED HOLDER SHALL HOLD ALL SHARES PURCHASED UNDER THE PLAN IN THE REGISTERED HOLDER’S NAME (AND NOT IN THE NAME OF ANY NOMINEE).” 20. Designation of Beneficiary. (a) Designation Procedure. Subject to local laws and procedures, a Participant may file a written designation of a beneficiary who is to receive (i) shares and cash, if any, from the Participant’s Plan unlessaccount if the Committee otherwise determines withParticipant dies subsequent to a Purchase Date but prior to delivery to the Participant of such shares and cash, or (ii) cash, if any, from the Participant’s Plan account if the Participant dies prior to the exercise of the Participant’s Purchase Right. If a married Participant designates a beneficiary other than the Participant’s spouse, the effectiveness of such designation may be subject to the consent of each affected Participant. The trusteethe Participant’s spouse. A Participant may change his or her beneficiary designation at any time by written notice to the Company. (b) Absence of such trusts may be authorizedBeneficiary Designation. If a Participant dies without an effective designation pursuant to disposeSection 20(a) of trust assets and reinvesta beneficiary who is living at the proceeds in alternative investments, subjecttime of the Participant’s death, the Company shall deliver any shares or cash credited to such terms and conditionsthe Participant’s Plan account to the Participant’s legal representative or as the Committee may specify and in accordance withotherwise required by applicable law. (j)21. Nonexclusivity ofNotices.
All notices or other communications by a Participant to the Plan. Neither the adoption ofCompany under or in connection with the Plan shall be deemed to have been duly given when received in the form specified by the Board nor its submission toCompany at the stockholders oflocation, or by the person, designated by the Company for approval shallthe receipt thereof. 22. Governing law. The Plan will be construed as creating any limitations on the power of the Board or a committee thereof to adopt such other incentive arrangements as it may deem desirable including incentive arrangementsgoverned by and awards which do not qualify under Code Section 162(m). (k)Payments in the Event of Forfeitures; Fractional Shares. Unless otherwise determined by the Committee, in the event of a forfeiture of an Award with respect to which a Participant paid cash or other consideration, the Participant shall be repaid the amount of such cash or other consideration. No fractional shares of Stock shall be issued or delivered pursuant to the Plan or any Award. The Committee shall determine whether cash, other Awards or other property shall be issued or paid in lieu of such fractional shares or whether such fractional shares or any rights thereto shall be forfeited or otherwise eliminated.
(l)Governing Law. The validity, construction and effect of the Plan, any rules and regulations under the Plan, and any Award agreement shall be determined in accordanceinterpreted consistently with the laws of the State of Delaware, without giving effectexcept as may be necessary to principlescomply with applicable requirements of conflicts of laws, and applicable federal law.
(m)23. Plan Effective DateAmendment and Stockholder Approval; Termination of Planthe Plan..
The Committee may at any time amend, suspend or terminate the Plan, became effectiveexcept that (a) no such amendment, suspension or termination shall affect Purchase Rights previously granted under the Plan unless expressly provided by the Committee, and (b) no such amendment, suspension or termination may materially adversely affect a Purchase Right previously granted under the Plan without the consent of the Participant, except to the extent permitted by the Plan or as may be necessary to qualify the Plan as an employee stock purchase plan pursuant to Section 423 or to comply with any applicable law, regulation or rule. In addition, an amendment to the Plan must be approved by the stockholders of the Company within twelve (12) months of the adoption of such amendment if such amendment would authorize the sale of more shares than are then authorized for issuance under the Plan or would change the definition of the corporations that may be designated by the Committee as Participating Companies. Notwithstanding the foregoing, in the event that the Committee determines that continuation of the Plan or an Offering would result in unfavorable financial accounting consequences to the Company, the Committee may, in its discretion and without the consent of any Participant, including with respect to an Offering Period then in progress: (i) terminate the Plan or any Offering Period, (ii) accelerate the Purchase Date of any Offering Period, (iii) reduce the discount or the method of determining the Purchase Price in any Offering Period (e.g., by determining the Purchase Price solely on the Effective Date. The Plan shall terminate on August 18, 2020, which is the tenth anniversarybasis of the dateFair Market Value on the Plan was originally adopted byPurchase Date), (iv) reduce the Board.maximum number of shares of Stock that may be purchased in any Offering Period, or (v) take any combination of the foregoing actions. PLAN APPROVAL HISTORY:
| | | Board or Stockholder Action
| | Approval Date | Adopted by the Board
| | August 18, 2010 | Approved by the Stockholders
| | October 19, 2010 | Amended and Restated by the Board
| | September 6, 2013 | Approved by the Stockholders
| | October 22, 2013 | Amended and Restated by the Compensation Committee
| | January 27, 2015 | 162(m) Provisions Approved by the Stockholders
| | October 20, 2015 | Amended and Restated by the Compensation Committee
| | August 12, 2016 | Amended and Restated by the Board
| | October 12, 2016 | Approved by the Stockholders
| | October 25, 2016 | Amended and Restated by the Compensation Committee
| | July 24, 2017 |
VOTE BY INTERNET Before The Meeting - Meeting—Go to www.proxyvote.com Use the Internet to transmit your voting instructions and for electronic delivery SYNAPTICS INCORPORATED of information up until 11:59 P.M. Eastern Time the day before thecut-off date 1251 MCKAY DRIVE or meeting date. Have your proxy card in hand when you access the web site SAN JOSE, CA 95131 and follow the instructions to obtain your records and to create an electronic voting instruction form. During The Meeting—Go to www.virtualshareholdermeeting.com/syna2017syna2019 You may attend the Meeting via the Internet and vote during the Meeting. Have the information that is printed in the box marked by the arrow available and follow the instructions. VOTE BYPHONE—1-800-690-6903 Use any touch-tone telephone to transmit your voting instructions up until 11:59 P.M. Eastern Time the day before thecut-off date or meeting date. Have your proxy card in hand when you call and then follow the instructions. VOTE BY MAIL Mark, sign and date your proxy card and return it in the postage-paid envelope we have provided or return it to Vote Processing, c/o Broadridge, 51 Mercedes Way, Edgewood, NY 11717. TO VOTE, MARK BLOCKS BELOW IN BLUE OR BLACK INK AS FOLLOWS: E32469-P96087 KEEP THIS PORTION FOR YOUR RECORDS THIS PROXY CARD IS VALID ONLY WHEN SIGNED AND DATED. DETACH AND RETURN THIS PORTION ONLYSYNAPTICS INCORPORATED 1251 MCKAY DRIVE SAN JOSE, CA 95131 E84281-P28199 SYNAPTICS INCORPORATED The Board of Directors recommends you vote FOR the following: 1. Election of Directors Nominees: For Against Abstain 1a. Francis F. LeeNominees: ! ! ! 1 Year1a. Kiva A. Allgood ! ! ! 1b. Michael E. Hurlston Against For Abstain The Board of Directors recommends you vote FOR proposals 2, Years 3, Years Abstain 3.4 and 5. ! ! ! 2. Proposal to provideapprove, on anon-binding advisory 1b. Nelson C. Chan ! ! ! vote onbasis, the frequencycompensation of futurethe Company’s Named Executive Officers for fiscal 2019non-binding(“say-on-pay”). ! ! ! ! advisory votes on the compensation of 1c. Richard L. Sanquini the Company’s named executive officers ! ! !(“say-on-frequency”). For Against Abstain 4.3. Proposal to ratify the appointment of KPMG LLP, an ! ! ! independent registered public accounting firm, as the The Board of Directors recommends you vote FOR Company’s independent auditor for the fiscal year ending proposals 2, 4 and 5, and “1 YEAR” on proposal 3. June 30, 2018. 5.27, 2020. ! ! ! 4. Proposal to approve an amendment to the Company’s 2019 Equity and Incentive Compensation Plan, which will replace the Company’s Amended and 2. Proposal to approve, on anon-binding advisory basis, ! ! ! Restated 2010 Incentive Compensation Plan to increasefor all new awards. ! ! ! the compensation of5. Proposal to approve the Company’s Named Executive the number of2019 Employee Stock Purchase Plan, which will replace the Company’s common stock authorized OfficersAmended and Restated 2010 Employee Stock Purchase Plan for fiscal 2017(“say-on-pay”). for issuance thereunder by 2,000,000 shares.all new awards. NOTE: Such other business as may properly come before the meeting or any adjournment or postponement thereof. ! For address changes and/or comments, please check this box ! and write them on the back where indicated. Please sign exactly as your name(s) appear(s) hereon. When signing as attorney, executor, administrator, or other fiduciary, please give full title as such. Joint owners should each sign personally. All holders must sign. If a corporation or partnership, please sign in full corporate or partnership name by authorized officer. Signature [PLEASE SIGN WITHIN BOX] Date Signature (Joint Owners) Date CONSOLIDATED ID TEMPLATE V1
Important Notice Regarding the Availability of Proxy Materials for the Annual Meeting:The Notice and Proxy Statement and Annual Report are available at www.proxyvote.com. E32470-P96087E84282-P28199 SYNAPTICS INCORPORATED Annual Meeting of Stockholders October 31, 201729, 2019 9:00 AM, Pacific Time This proxy is solicited by the Board of Directors The stockholder(s) hereby appoint(s) Francis F. LeeKermit Nolan and Richard A. Bergman,John McFarland, or either of them, as proxies, each with the power to appoint his substitute, and hereby authorize(s) them to represent and to vote, as designated on the reverse side of this ballot, all of the shares of Common Stock of SYNAPTICS INCORPORATED that the stockholder(s) is/are entitled to vote at the AnnualtheAnnual Meeting of Stockholders to be held at 9:00 AM, Pacific Time on October 31, 2017,29, 2019, via live interactive webcast on the Internet at www.virtualshareholdermeeting.com/syna2017,syna2019, and any adjournment or postponement thereof. This proxy, when properly executed, will be voted in the manner directed herein. If no such direction is made, this proxy will be voted in accordance with the Board of Directors’ recommendations. Address Changes/Comments: (If you noted any Address Changes/Comments above, please mark corresponding box on the reverse side.) Continued and to be signed on reverse side |